Uruguayan vs Immigrants from Armenia Per Capita Income
COMPARE
Uruguayan
Immigrants from Armenia
Per Capita Income
Per Capita Income Comparison
Uruguayans
Immigrants from Armenia
$44,318
PER CAPITA INCOME
67.6/ 100
METRIC RATING
155th/ 347
METRIC RANK
$44,552
PER CAPITA INCOME
73.1/ 100
METRIC RATING
148th/ 347
METRIC RANK
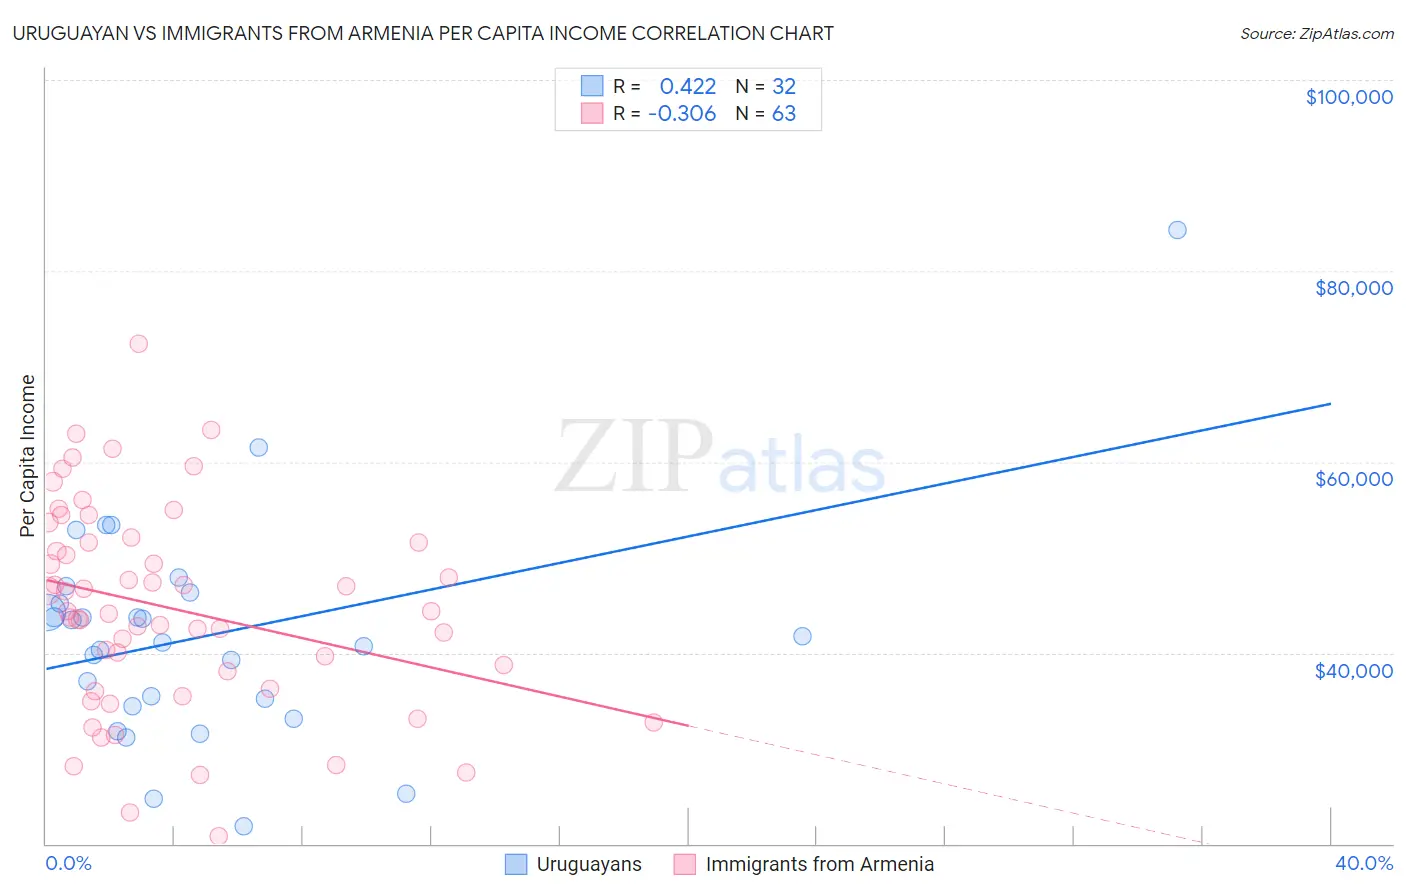
Uruguayan vs Immigrants from Armenia Per Capita Income Correlation Chart
The statistical analysis conducted on geographies consisting of 144,785,218 people shows a moderate positive correlation between the proportion of Uruguayans and per capita income in the United States with a correlation coefficient (R) of 0.422 and weighted average of $44,318. Similarly, the statistical analysis conducted on geographies consisting of 97,724,966 people shows a mild negative correlation between the proportion of Immigrants from Armenia and per capita income in the United States with a correlation coefficient (R) of -0.306 and weighted average of $44,552, a difference of 0.53%.
Per Capita Income Correlation Summary
| Measurement | Uruguayan | Immigrants from Armenia |
| Minimum | $21,859 | $20,812 |
| Maximum | $84,313 | $72,364 |
| Range | $62,454 | $51,552 |
| Mean | $41,831 | $44,626 |
| Median | $41,436 | $44,298 |
| Interquartile 25% (IQ1) | $34,824 | $36,237 |
| Interquartile 75% (IQ3) | $45,774 | $51,558 |
| Interquartile Range (IQR) | $10,950 | $15,321 |
| Standard Deviation (Sample) | $11,692 | $10,685 |
| Standard Deviation (Population) | $11,508 | $10,600 |
Demographics Similar to Uruguayans and Immigrants from Armenia by Per Capita Income
In terms of per capita income, the demographic groups most similar to Uruguayans are Portuguese ($44,362, a difference of 0.10%), Slovak ($44,229, a difference of 0.20%), South American Indian ($44,206, a difference of 0.25%), Scottish ($44,440, a difference of 0.27%), and Immigrants from Nepal ($44,187, a difference of 0.30%). Similarly, the demographic groups most similar to Immigrants from Armenia are Korean ($44,522, a difference of 0.070%), Czech ($44,595, a difference of 0.10%), Immigrants from Eritrea ($44,509, a difference of 0.10%), Norwegian ($44,480, a difference of 0.16%), and Peruvian ($44,479, a difference of 0.17%).
| Demographics | Rating | Rank | Per Capita Income |
| Slavs | 82.6 /100 | #141 | Excellent $45,049 |
| Ugandans | 82.6 /100 | #142 | Excellent $45,047 |
| Immigrants | Uganda | 82.5 /100 | #143 | Excellent $45,043 |
| Icelanders | 81.6 /100 | #144 | Excellent $44,987 |
| Immigrants | Afghanistan | 78.0 /100 | #145 | Good $44,790 |
| Irish | 75.8 /100 | #146 | Good $44,679 |
| Czechs | 74.1 /100 | #147 | Good $44,595 |
| Immigrants | Armenia | 73.1 /100 | #148 | Good $44,552 |
| Koreans | 72.5 /100 | #149 | Good $44,522 |
| Immigrants | Eritrea | 72.1 /100 | #150 | Good $44,509 |
| Norwegians | 71.5 /100 | #151 | Good $44,480 |
| Peruvians | 71.5 /100 | #152 | Good $44,479 |
| Scottish | 70.6 /100 | #153 | Good $44,440 |
| Portuguese | 68.7 /100 | #154 | Good $44,362 |
| Uruguayans | 67.6 /100 | #155 | Good $44,318 |
| Slovaks | 65.4 /100 | #156 | Good $44,229 |
| South American Indians | 64.8 /100 | #157 | Good $44,206 |
| Immigrants | Nepal | 64.3 /100 | #158 | Good $44,187 |
| South Americans | 62.4 /100 | #159 | Good $44,114 |
| Danes | 61.9 /100 | #160 | Good $44,095 |
| Costa Ricans | 61.8 /100 | #161 | Good $44,090 |