Uruguayan vs Liberian Per Capita Income
COMPARE
Uruguayan
Liberian
Per Capita Income
Per Capita Income Comparison
Uruguayans
Liberians
$44,318
PER CAPITA INCOME
67.6/ 100
METRIC RATING
155th/ 347
METRIC RANK
$38,780
PER CAPITA INCOME
0.4/ 100
METRIC RATING
268th/ 347
METRIC RANK
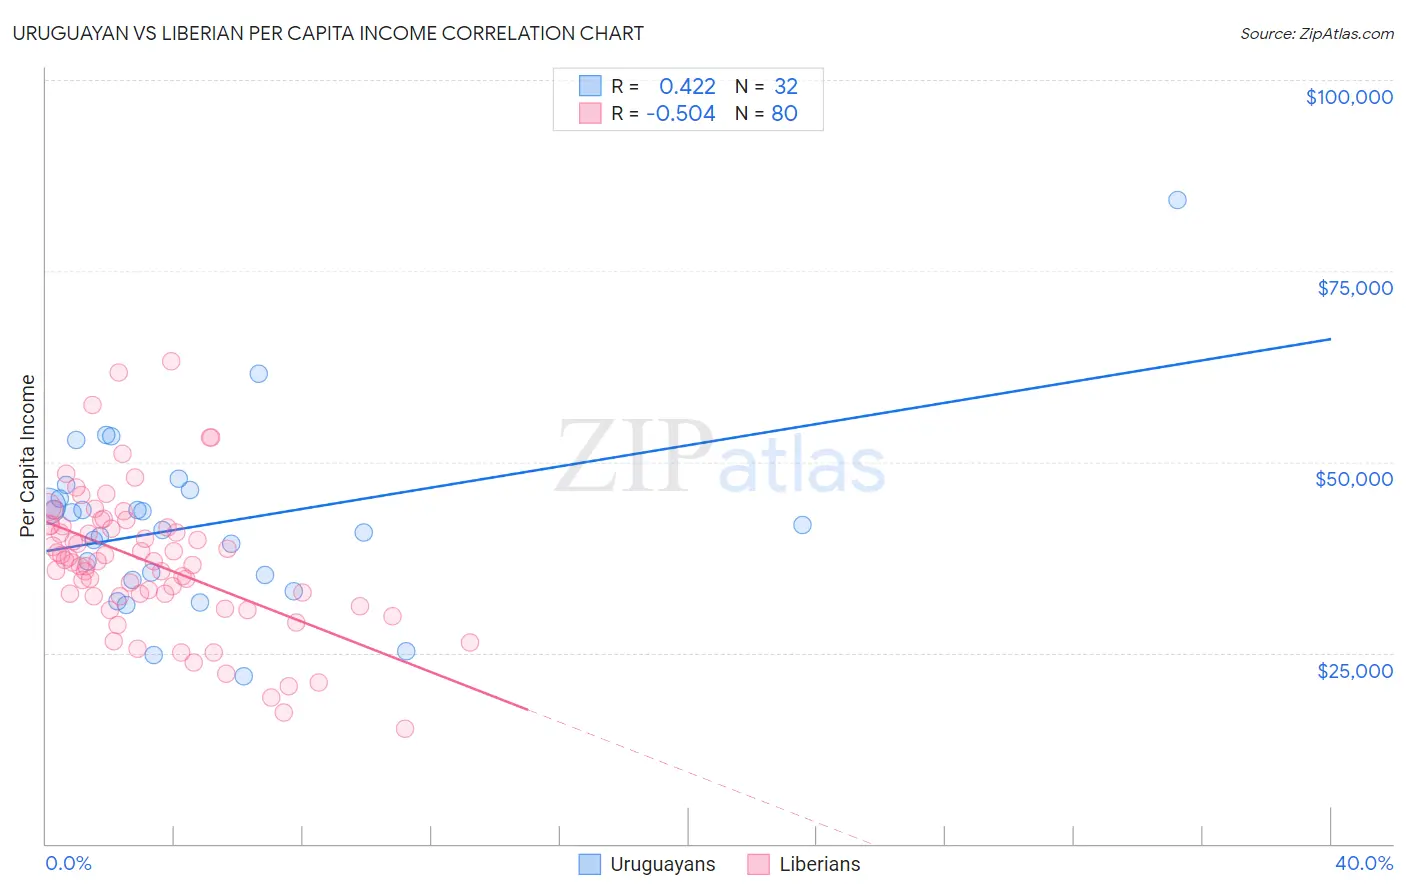
Uruguayan vs Liberian Per Capita Income Correlation Chart
The statistical analysis conducted on geographies consisting of 144,785,218 people shows a moderate positive correlation between the proportion of Uruguayans and per capita income in the United States with a correlation coefficient (R) of 0.422 and weighted average of $44,318. Similarly, the statistical analysis conducted on geographies consisting of 118,107,140 people shows a substantial negative correlation between the proportion of Liberians and per capita income in the United States with a correlation coefficient (R) of -0.504 and weighted average of $38,780, a difference of 14.3%.
Per Capita Income Correlation Summary
| Measurement | Uruguayan | Liberian |
| Minimum | $21,859 | $15,041 |
| Maximum | $84,313 | $63,224 |
| Range | $62,454 | $48,183 |
| Mean | $41,831 | $36,863 |
| Median | $41,436 | $37,001 |
| Interquartile 25% (IQ1) | $34,824 | $32,406 |
| Interquartile 75% (IQ3) | $45,774 | $41,709 |
| Interquartile Range (IQR) | $10,950 | $9,304 |
| Standard Deviation (Sample) | $11,692 | $9,178 |
| Standard Deviation (Population) | $11,508 | $9,120 |
Similar Demographics by Per Capita Income
Demographics Similar to Uruguayans by Per Capita Income
In terms of per capita income, the demographic groups most similar to Uruguayans are Portuguese ($44,362, a difference of 0.10%), Slovak ($44,229, a difference of 0.20%), South American Indian ($44,206, a difference of 0.25%), Scottish ($44,440, a difference of 0.27%), and Immigrants from Nepal ($44,187, a difference of 0.30%).
| Demographics | Rating | Rank | Per Capita Income |
| Immigrants | Armenia | 73.1 /100 | #148 | Good $44,552 |
| Koreans | 72.5 /100 | #149 | Good $44,522 |
| Immigrants | Eritrea | 72.1 /100 | #150 | Good $44,509 |
| Norwegians | 71.5 /100 | #151 | Good $44,480 |
| Peruvians | 71.5 /100 | #152 | Good $44,479 |
| Scottish | 70.6 /100 | #153 | Good $44,440 |
| Portuguese | 68.7 /100 | #154 | Good $44,362 |
| Uruguayans | 67.6 /100 | #155 | Good $44,318 |
| Slovaks | 65.4 /100 | #156 | Good $44,229 |
| South American Indians | 64.8 /100 | #157 | Good $44,206 |
| Immigrants | Nepal | 64.3 /100 | #158 | Good $44,187 |
| South Americans | 62.4 /100 | #159 | Good $44,114 |
| Danes | 61.9 /100 | #160 | Good $44,095 |
| Costa Ricans | 61.8 /100 | #161 | Good $44,090 |
| Swiss | 61.4 /100 | #162 | Good $44,076 |
Demographics Similar to Liberians by Per Capita Income
In terms of per capita income, the demographic groups most similar to Liberians are Immigrants from Jamaica ($38,766, a difference of 0.040%), Immigrants from Zaire ($38,848, a difference of 0.17%), Salvadoran ($38,858, a difference of 0.20%), Immigrants from Belize ($38,614, a difference of 0.43%), and Central American ($38,560, a difference of 0.57%).
| Demographics | Rating | Rank | Per Capita Income |
| Marshallese | 0.6 /100 | #261 | Tragic $39,108 |
| Iroquois | 0.6 /100 | #262 | Tragic $39,104 |
| Belizeans | 0.6 /100 | #263 | Tragic $39,097 |
| Americans | 0.6 /100 | #264 | Tragic $39,039 |
| Spanish Americans | 0.5 /100 | #265 | Tragic $39,012 |
| Salvadorans | 0.5 /100 | #266 | Tragic $38,858 |
| Immigrants | Zaire | 0.4 /100 | #267 | Tragic $38,848 |
| Liberians | 0.4 /100 | #268 | Tragic $38,780 |
| Immigrants | Jamaica | 0.4 /100 | #269 | Tragic $38,766 |
| Immigrants | Belize | 0.3 /100 | #270 | Tragic $38,614 |
| Central Americans | 0.3 /100 | #271 | Tragic $38,560 |
| Immigrants | Cabo Verde | 0.3 /100 | #272 | Tragic $38,540 |
| Nepalese | 0.3 /100 | #273 | Tragic $38,442 |
| Immigrants | El Salvador | 0.3 /100 | #274 | Tragic $38,394 |
| Immigrants | Liberia | 0.2 /100 | #275 | Tragic $38,165 |