Uruguayan vs Argentinean Per Capita Income
COMPARE
Uruguayan
Argentinean
Per Capita Income
Per Capita Income Comparison
Uruguayans
Argentineans
$44,318
PER CAPITA INCOME
67.6/ 100
METRIC RATING
155th/ 347
METRIC RANK
$49,862
PER CAPITA INCOME
99.9/ 100
METRIC RATING
61st/ 347
METRIC RANK
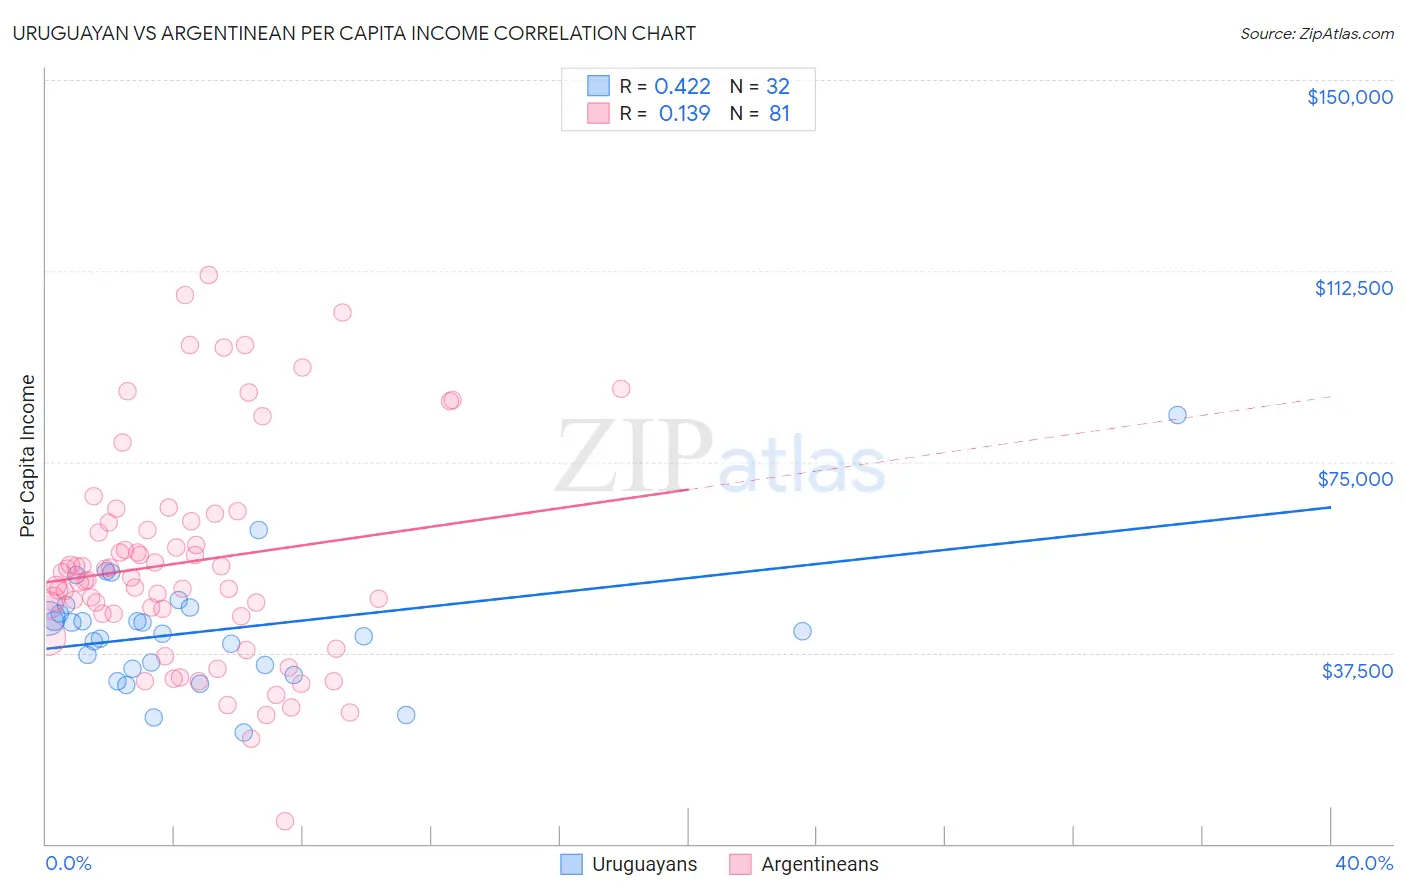
Uruguayan vs Argentinean Per Capita Income Correlation Chart
The statistical analysis conducted on geographies consisting of 144,785,218 people shows a moderate positive correlation between the proportion of Uruguayans and per capita income in the United States with a correlation coefficient (R) of 0.422 and weighted average of $44,318. Similarly, the statistical analysis conducted on geographies consisting of 297,154,403 people shows a poor positive correlation between the proportion of Argentineans and per capita income in the United States with a correlation coefficient (R) of 0.139 and weighted average of $49,862, a difference of 12.5%.
Per Capita Income Correlation Summary
| Measurement | Uruguayan | Argentinean |
| Minimum | $21,859 | $4,418 |
| Maximum | $84,313 | $111,640 |
| Range | $62,454 | $107,222 |
| Mean | $41,831 | $55,287 |
| Median | $41,436 | $51,750 |
| Interquartile 25% (IQ1) | $34,824 | $44,864 |
| Interquartile 75% (IQ3) | $45,774 | $63,214 |
| Interquartile Range (IQR) | $10,950 | $18,350 |
| Standard Deviation (Sample) | $11,692 | $21,524 |
| Standard Deviation (Population) | $11,508 | $21,390 |
Similar Demographics by Per Capita Income
Demographics Similar to Uruguayans by Per Capita Income
In terms of per capita income, the demographic groups most similar to Uruguayans are Portuguese ($44,362, a difference of 0.10%), Slovak ($44,229, a difference of 0.20%), South American Indian ($44,206, a difference of 0.25%), Scottish ($44,440, a difference of 0.27%), and Immigrants from Nepal ($44,187, a difference of 0.30%).
| Demographics | Rating | Rank | Per Capita Income |
| Immigrants | Armenia | 73.1 /100 | #148 | Good $44,552 |
| Koreans | 72.5 /100 | #149 | Good $44,522 |
| Immigrants | Eritrea | 72.1 /100 | #150 | Good $44,509 |
| Norwegians | 71.5 /100 | #151 | Good $44,480 |
| Peruvians | 71.5 /100 | #152 | Good $44,479 |
| Scottish | 70.6 /100 | #153 | Good $44,440 |
| Portuguese | 68.7 /100 | #154 | Good $44,362 |
| Uruguayans | 67.6 /100 | #155 | Good $44,318 |
| Slovaks | 65.4 /100 | #156 | Good $44,229 |
| South American Indians | 64.8 /100 | #157 | Good $44,206 |
| Immigrants | Nepal | 64.3 /100 | #158 | Good $44,187 |
| South Americans | 62.4 /100 | #159 | Good $44,114 |
| Danes | 61.9 /100 | #160 | Good $44,095 |
| Costa Ricans | 61.8 /100 | #161 | Good $44,090 |
| Swiss | 61.4 /100 | #162 | Good $44,076 |
Demographics Similar to Argentineans by Per Capita Income
In terms of per capita income, the demographic groups most similar to Argentineans are Immigrants from Scotland ($49,893, a difference of 0.060%), Bhutanese ($49,894, a difference of 0.070%), Immigrants from Malaysia ($49,983, a difference of 0.24%), Immigrants from Asia ($49,741, a difference of 0.24%), and South African ($50,044, a difference of 0.37%).
| Demographics | Rating | Rank | Per Capita Income |
| Immigrants | Belarus | 99.9 /100 | #54 | Exceptional $50,303 |
| Immigrants | Western Europe | 99.9 /100 | #55 | Exceptional $50,065 |
| Asians | 99.9 /100 | #56 | Exceptional $50,057 |
| South Africans | 99.9 /100 | #57 | Exceptional $50,044 |
| Immigrants | Malaysia | 99.9 /100 | #58 | Exceptional $49,983 |
| Bhutanese | 99.9 /100 | #59 | Exceptional $49,894 |
| Immigrants | Scotland | 99.9 /100 | #60 | Exceptional $49,893 |
| Argentineans | 99.9 /100 | #61 | Exceptional $49,862 |
| Immigrants | Asia | 99.9 /100 | #62 | Exceptional $49,741 |
| Maltese | 99.9 /100 | #63 | Exceptional $49,640 |
| Immigrants | Argentina | 99.9 /100 | #64 | Exceptional $49,627 |
| Bolivians | 99.9 /100 | #65 | Exceptional $49,526 |
| Immigrants | Bulgaria | 99.9 /100 | #66 | Exceptional $49,482 |
| Immigrants | Romania | 99.9 /100 | #67 | Exceptional $49,463 |
| Lithuanians | 99.8 /100 | #68 | Exceptional $49,448 |