Ugandan vs Immigrants from Cameroon Single Mother Households
COMPARE
Ugandan
Immigrants from Cameroon
Single Mother Households
Single Mother Households Comparison
Ugandans
Immigrants from Cameroon
6.5%
SINGLE MOTHER HOUSEHOLDS
25.6/ 100
METRIC RATING
185th/ 347
METRIC RANK
7.9%
SINGLE MOTHER HOUSEHOLDS
0.0/ 100
METRIC RATING
293rd/ 347
METRIC RANK
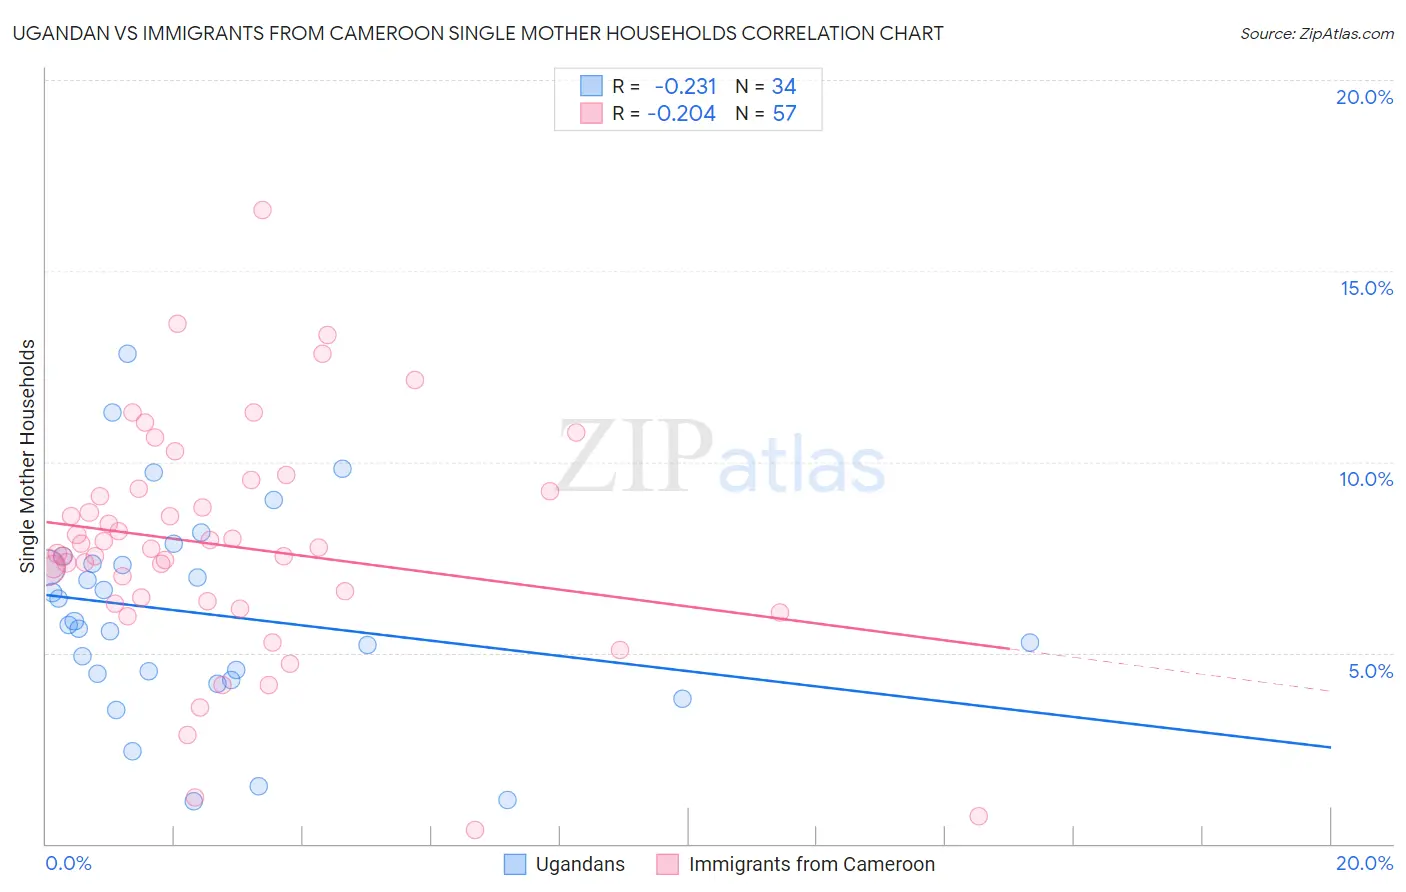
Ugandan vs Immigrants from Cameroon Single Mother Households Correlation Chart
The statistical analysis conducted on geographies consisting of 93,972,955 people shows a weak negative correlation between the proportion of Ugandans and percentage of single mother households in the United States with a correlation coefficient (R) of -0.231 and weighted average of 6.5%. Similarly, the statistical analysis conducted on geographies consisting of 130,708,507 people shows a weak negative correlation between the proportion of Immigrants from Cameroon and percentage of single mother households in the United States with a correlation coefficient (R) of -0.204 and weighted average of 7.9%, a difference of 21.2%.
Single Mother Households Correlation Summary
| Measurement | Ugandan | Immigrants from Cameroon |
| Minimum | 1.1% | 0.36% |
| Maximum | 12.8% | 16.6% |
| Range | 11.7% | 16.2% |
| Mean | 6.0% | 7.8% |
| Median | 5.8% | 7.7% |
| Interquartile 25% (IQ1) | 4.5% | 6.3% |
| Interquartile 75% (IQ3) | 7.3% | 9.3% |
| Interquartile Range (IQR) | 2.9% | 2.9% |
| Standard Deviation (Sample) | 2.7% | 3.0% |
| Standard Deviation (Population) | 2.6% | 3.0% |
Similar Demographics by Single Mother Households
Demographics Similar to Ugandans by Single Mother Households
In terms of single mother households, the demographic groups most similar to Ugandans are Ethiopian (6.5%, a difference of 0.060%), Costa Rican (6.5%, a difference of 0.11%), Immigrants from Afghanistan (6.5%, a difference of 0.13%), Ottawa (6.5%, a difference of 0.26%), and Spaniard (6.5%, a difference of 0.30%).
| Demographics | Rating | Rank | Single Mother Households |
| Portuguese | 40.0 /100 | #178 | Fair 6.4% |
| Hmong | 39.8 /100 | #179 | Fair 6.4% |
| Immigrants | Nepal | 36.1 /100 | #180 | Fair 6.4% |
| Spanish | 33.4 /100 | #181 | Fair 6.4% |
| South American Indians | 33.4 /100 | #182 | Fair 6.4% |
| Spaniards | 27.8 /100 | #183 | Fair 6.5% |
| Ethiopians | 26.0 /100 | #184 | Fair 6.5% |
| Ugandans | 25.6 /100 | #185 | Fair 6.5% |
| Costa Ricans | 24.8 /100 | #186 | Fair 6.5% |
| Immigrants | Afghanistan | 24.7 /100 | #187 | Fair 6.5% |
| Ottawa | 23.8 /100 | #188 | Fair 6.5% |
| Delaware | 23.3 /100 | #189 | Fair 6.5% |
| Peruvians | 21.6 /100 | #190 | Fair 6.5% |
| Samoans | 21.2 /100 | #191 | Fair 6.5% |
| Americans | 19.0 /100 | #192 | Poor 6.6% |
Demographics Similar to Immigrants from Cameroon by Single Mother Households
In terms of single mother households, the demographic groups most similar to Immigrants from Cameroon are Apache (7.9%, a difference of 0.10%), Ghanaian (7.8%, a difference of 0.36%), West Indian (7.8%, a difference of 0.37%), Barbadian (7.9%, a difference of 0.39%), and Immigrants from Nigeria (7.8%, a difference of 0.45%).
| Demographics | Rating | Rank | Single Mother Households |
| Immigrants | Middle Africa | 0.0 /100 | #286 | Tragic 7.7% |
| Immigrants | Guatemala | 0.0 /100 | #287 | Tragic 7.7% |
| Sierra Leoneans | 0.0 /100 | #288 | Tragic 7.7% |
| Sub-Saharan Africans | 0.0 /100 | #289 | Tragic 7.8% |
| Immigrants | Nigeria | 0.0 /100 | #290 | Tragic 7.8% |
| West Indians | 0.0 /100 | #291 | Tragic 7.8% |
| Ghanaians | 0.0 /100 | #292 | Tragic 7.8% |
| Immigrants | Cameroon | 0.0 /100 | #293 | Tragic 7.9% |
| Apache | 0.0 /100 | #294 | Tragic 7.9% |
| Barbadians | 0.0 /100 | #295 | Tragic 7.9% |
| Immigrants | Latin America | 0.0 /100 | #296 | Tragic 7.9% |
| Hispanics or Latinos | 0.0 /100 | #297 | Tragic 7.9% |
| Immigrants | West Indies | 0.0 /100 | #298 | Tragic 7.9% |
| Houma | 0.0 /100 | #299 | Tragic 7.9% |
| Mexicans | 0.0 /100 | #300 | Tragic 8.0% |