Arapaho vs Costa Rican Per Capita Income
COMPARE
Arapaho
Costa Rican
Per Capita Income
Per Capita Income Comparison
Arapaho
Costa Ricans
$32,345
PER CAPITA INCOME
0.0/ 100
METRIC RATING
338th/ 347
METRIC RANK
$44,090
PER CAPITA INCOME
61.8/ 100
METRIC RATING
161st/ 347
METRIC RANK
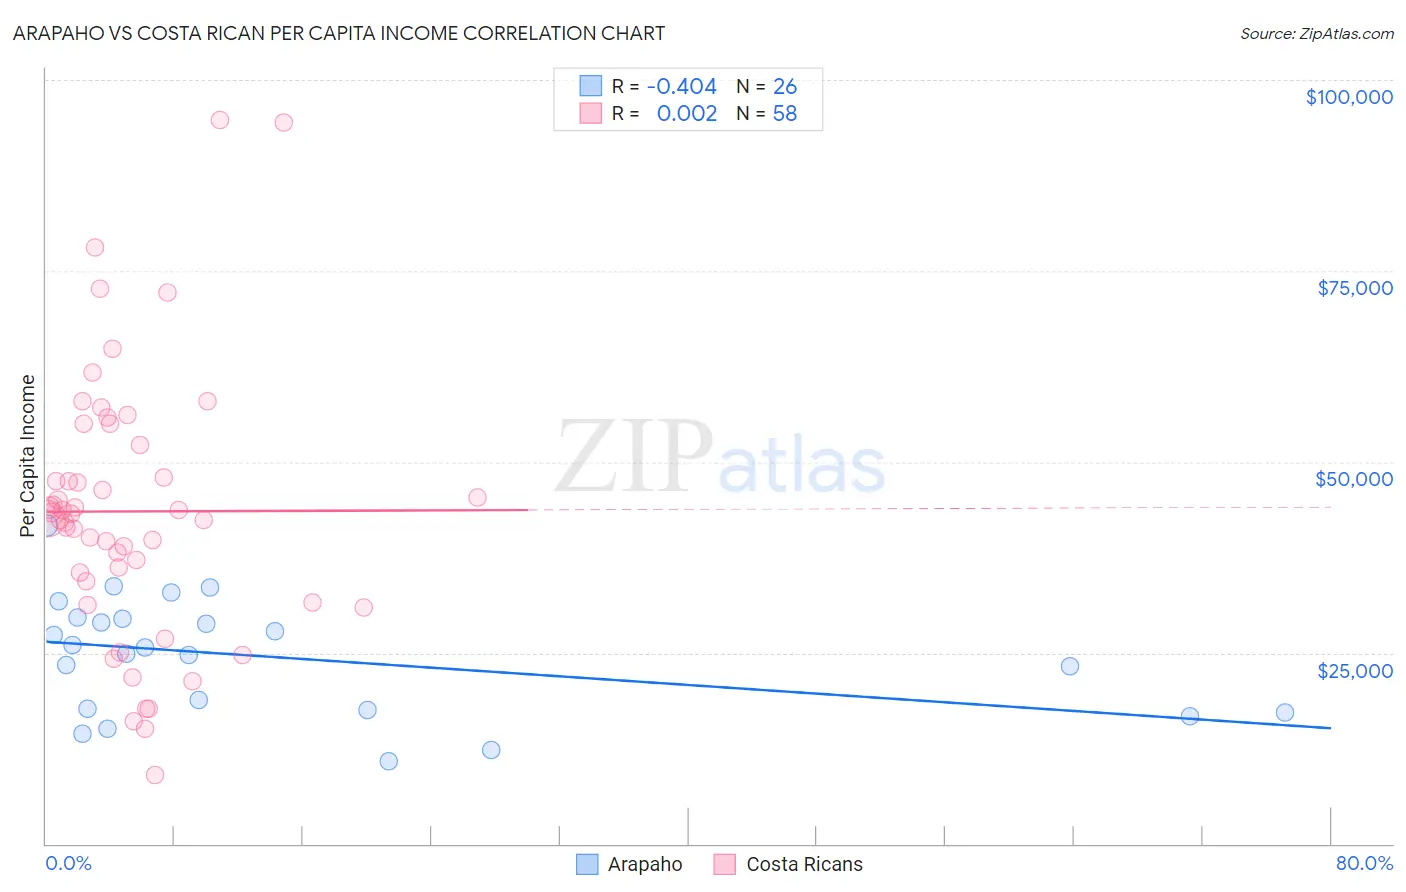
Arapaho vs Costa Rican Per Capita Income Correlation Chart
The statistical analysis conducted on geographies consisting of 29,780,267 people shows a moderate negative correlation between the proportion of Arapaho and per capita income in the United States with a correlation coefficient (R) of -0.404 and weighted average of $32,345. Similarly, the statistical analysis conducted on geographies consisting of 253,595,957 people shows no correlation between the proportion of Costa Ricans and per capita income in the United States with a correlation coefficient (R) of 0.002 and weighted average of $44,090, a difference of 36.3%.
Per Capita Income Correlation Summary
| Measurement | Arapaho | Costa Rican |
| Minimum | $10,798 | $9,066 |
| Maximum | $41,687 | $94,709 |
| Range | $30,889 | $85,643 |
| Mean | $24,378 | $43,514 |
| Median | $25,279 | $42,885 |
| Interquartile 25% (IQ1) | $17,440 | $34,433 |
| Interquartile 75% (IQ3) | $29,495 | $52,139 |
| Interquartile Range (IQR) | $12,055 | $17,706 |
| Standard Deviation (Sample) | $7,667 | $17,472 |
| Standard Deviation (Population) | $7,518 | $17,321 |
Similar Demographics by Per Capita Income
Demographics Similar to Arapaho by Per Capita Income
In terms of per capita income, the demographic groups most similar to Arapaho are Pueblo ($32,012, a difference of 1.0%), Crow ($31,729, a difference of 1.9%), Houma ($32,996, a difference of 2.0%), Yakama ($33,009, a difference of 2.1%), and Yuman ($33,236, a difference of 2.8%).
| Demographics | Rating | Rank | Per Capita Income |
| Immigrants | Mexico | 0.0 /100 | #331 | Tragic $33,931 |
| Sioux | 0.0 /100 | #332 | Tragic $33,921 |
| Immigrants | Yemen | 0.0 /100 | #333 | Tragic $33,696 |
| Natives/Alaskans | 0.0 /100 | #334 | Tragic $33,279 |
| Yuman | 0.0 /100 | #335 | Tragic $33,236 |
| Yakama | 0.0 /100 | #336 | Tragic $33,009 |
| Houma | 0.0 /100 | #337 | Tragic $32,996 |
| Arapaho | 0.0 /100 | #338 | Tragic $32,345 |
| Pueblo | 0.0 /100 | #339 | Tragic $32,012 |
| Crow | 0.0 /100 | #340 | Tragic $31,729 |
| Puerto Ricans | 0.0 /100 | #341 | Tragic $31,268 |
| Hopi | 0.0 /100 | #342 | Tragic $31,177 |
| Pima | 0.0 /100 | #343 | Tragic $30,644 |
| Yup'ik | 0.0 /100 | #344 | Tragic $30,518 |
| Tohono O'odham | 0.0 /100 | #345 | Tragic $30,256 |
Demographics Similar to Costa Ricans by Per Capita Income
In terms of per capita income, the demographic groups most similar to Costa Ricans are Danish ($44,095, a difference of 0.010%), Swiss ($44,076, a difference of 0.030%), South American ($44,114, a difference of 0.050%), Immigrants from South America ($44,068, a difference of 0.050%), and Sri Lankan ($44,014, a difference of 0.17%).
| Demographics | Rating | Rank | Per Capita Income |
| Portuguese | 68.7 /100 | #154 | Good $44,362 |
| Uruguayans | 67.6 /100 | #155 | Good $44,318 |
| Slovaks | 65.4 /100 | #156 | Good $44,229 |
| South American Indians | 64.8 /100 | #157 | Good $44,206 |
| Immigrants | Nepal | 64.3 /100 | #158 | Good $44,187 |
| South Americans | 62.4 /100 | #159 | Good $44,114 |
| Danes | 61.9 /100 | #160 | Good $44,095 |
| Costa Ricans | 61.8 /100 | #161 | Good $44,090 |
| Swiss | 61.4 /100 | #162 | Good $44,076 |
| Immigrants | South America | 61.2 /100 | #163 | Good $44,068 |
| Sri Lankans | 59.8 /100 | #164 | Average $44,014 |
| Immigrants | Philippines | 59.4 /100 | #165 | Average $44,000 |
| Immigrants | Uruguay | 59.3 /100 | #166 | Average $43,997 |
| English | 58.9 /100 | #167 | Average $43,982 |
| Belgians | 58.1 /100 | #168 | Average $43,951 |