Central American Indian vs Costa Rican Per Capita Income
COMPARE
Central American Indian
Costa Rican
Per Capita Income
Per Capita Income Comparison
Central American Indians
Costa Ricans
$37,699
PER CAPITA INCOME
0.1/ 100
METRIC RATING
286th/ 347
METRIC RANK
$44,090
PER CAPITA INCOME
61.8/ 100
METRIC RATING
161st/ 347
METRIC RANK
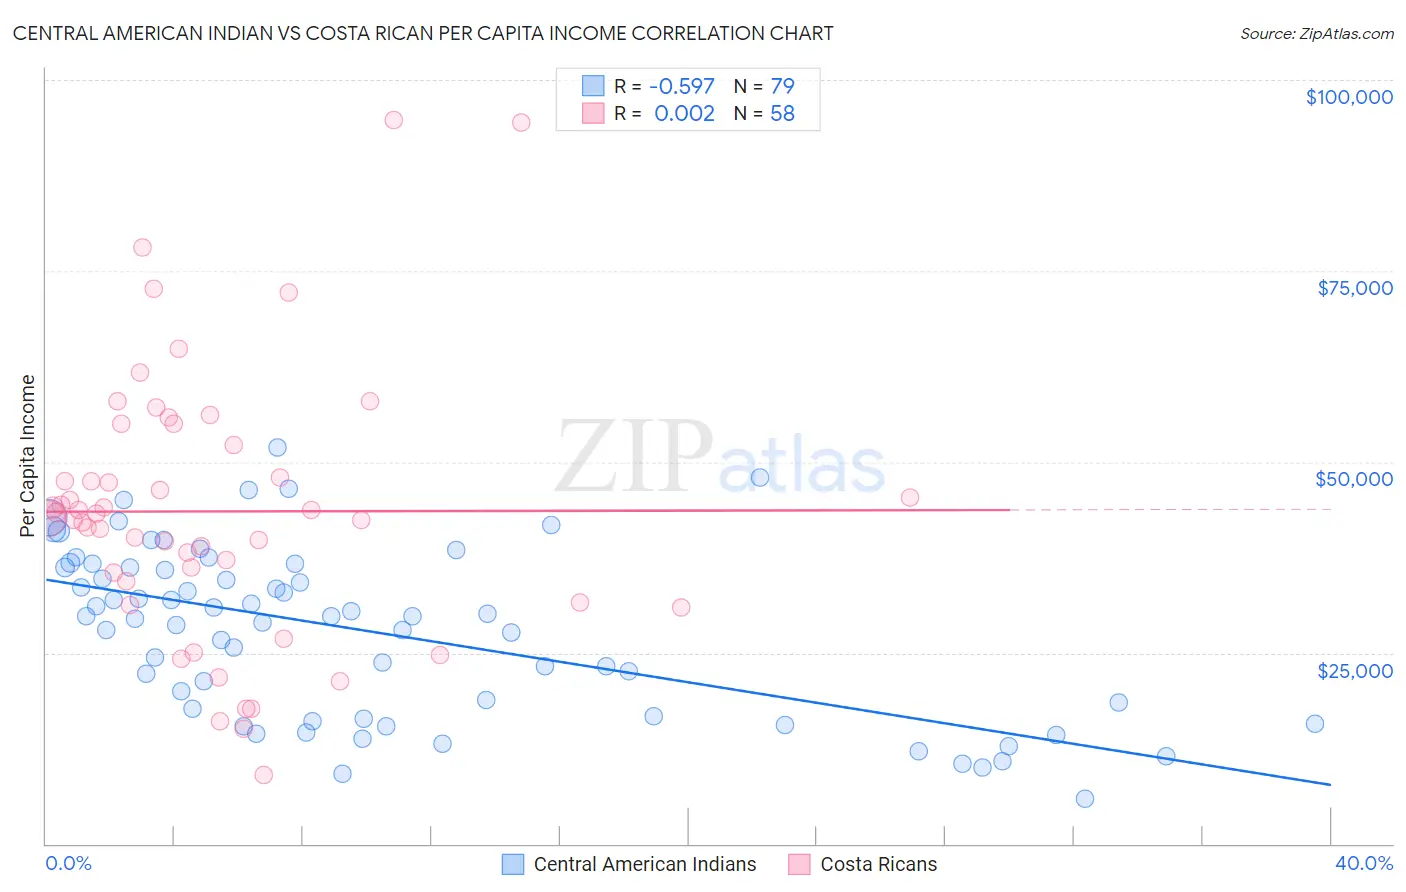
Central American Indian vs Costa Rican Per Capita Income Correlation Chart
The statistical analysis conducted on geographies consisting of 326,146,034 people shows a substantial negative correlation between the proportion of Central American Indians and per capita income in the United States with a correlation coefficient (R) of -0.597 and weighted average of $37,699. Similarly, the statistical analysis conducted on geographies consisting of 253,595,957 people shows no correlation between the proportion of Costa Ricans and per capita income in the United States with a correlation coefficient (R) of 0.002 and weighted average of $44,090, a difference of 17.0%.
Per Capita Income Correlation Summary
| Measurement | Central American Indian | Costa Rican |
| Minimum | $5,814 | $9,066 |
| Maximum | $51,916 | $94,709 |
| Range | $46,102 | $85,643 |
| Mean | $27,773 | $43,514 |
| Median | $29,805 | $42,885 |
| Interquartile 25% (IQ1) | $16,640 | $34,433 |
| Interquartile 75% (IQ3) | $36,169 | $52,139 |
| Interquartile Range (IQR) | $19,529 | $17,706 |
| Standard Deviation (Sample) | $10,964 | $17,472 |
| Standard Deviation (Population) | $10,894 | $17,321 |
Similar Demographics by Per Capita Income
Demographics Similar to Central American Indians by Per Capita Income
In terms of per capita income, the demographic groups most similar to Central American Indians are Dominican ($37,697, a difference of 0.010%), Blackfeet ($37,695, a difference of 0.010%), Guatemalan ($37,766, a difference of 0.18%), African ($37,785, a difference of 0.23%), and U.S. Virgin Islander ($37,589, a difference of 0.29%).
| Demographics | Rating | Rank | Per Capita Income |
| Colville | 0.2 /100 | #279 | Tragic $38,047 |
| Potawatomi | 0.2 /100 | #280 | Tragic $38,046 |
| Immigrants | Dominica | 0.2 /100 | #281 | Tragic $37,952 |
| Immigrants | Laos | 0.1 /100 | #282 | Tragic $37,857 |
| Pennsylvania Germans | 0.1 /100 | #283 | Tragic $37,842 |
| Africans | 0.1 /100 | #284 | Tragic $37,785 |
| Guatemalans | 0.1 /100 | #285 | Tragic $37,766 |
| Central American Indians | 0.1 /100 | #286 | Tragic $37,699 |
| Dominicans | 0.1 /100 | #287 | Tragic $37,697 |
| Blackfeet | 0.1 /100 | #288 | Tragic $37,695 |
| U.S. Virgin Islanders | 0.1 /100 | #289 | Tragic $37,589 |
| Immigrants | Guatemala | 0.1 /100 | #290 | Tragic $37,550 |
| Cajuns | 0.1 /100 | #291 | Tragic $37,527 |
| Immigrants | Micronesia | 0.1 /100 | #292 | Tragic $37,464 |
| Mexican American Indians | 0.1 /100 | #293 | Tragic $37,407 |
Demographics Similar to Costa Ricans by Per Capita Income
In terms of per capita income, the demographic groups most similar to Costa Ricans are Danish ($44,095, a difference of 0.010%), Swiss ($44,076, a difference of 0.030%), South American ($44,114, a difference of 0.050%), Immigrants from South America ($44,068, a difference of 0.050%), and Sri Lankan ($44,014, a difference of 0.17%).
| Demographics | Rating | Rank | Per Capita Income |
| Portuguese | 68.7 /100 | #154 | Good $44,362 |
| Uruguayans | 67.6 /100 | #155 | Good $44,318 |
| Slovaks | 65.4 /100 | #156 | Good $44,229 |
| South American Indians | 64.8 /100 | #157 | Good $44,206 |
| Immigrants | Nepal | 64.3 /100 | #158 | Good $44,187 |
| South Americans | 62.4 /100 | #159 | Good $44,114 |
| Danes | 61.9 /100 | #160 | Good $44,095 |
| Costa Ricans | 61.8 /100 | #161 | Good $44,090 |
| Swiss | 61.4 /100 | #162 | Good $44,076 |
| Immigrants | South America | 61.2 /100 | #163 | Good $44,068 |
| Sri Lankans | 59.8 /100 | #164 | Average $44,014 |
| Immigrants | Philippines | 59.4 /100 | #165 | Average $44,000 |
| Immigrants | Uruguay | 59.3 /100 | #166 | Average $43,997 |
| English | 58.9 /100 | #167 | Average $43,982 |
| Belgians | 58.1 /100 | #168 | Average $43,951 |