Comanche vs Costa Rican Per Capita Income
COMPARE
Comanche
Costa Rican
Per Capita Income
Per Capita Income Comparison
Comanche
Costa Ricans
$38,088
PER CAPITA INCOME
0.2/ 100
METRIC RATING
277th/ 347
METRIC RANK
$44,090
PER CAPITA INCOME
61.8/ 100
METRIC RATING
161st/ 347
METRIC RANK
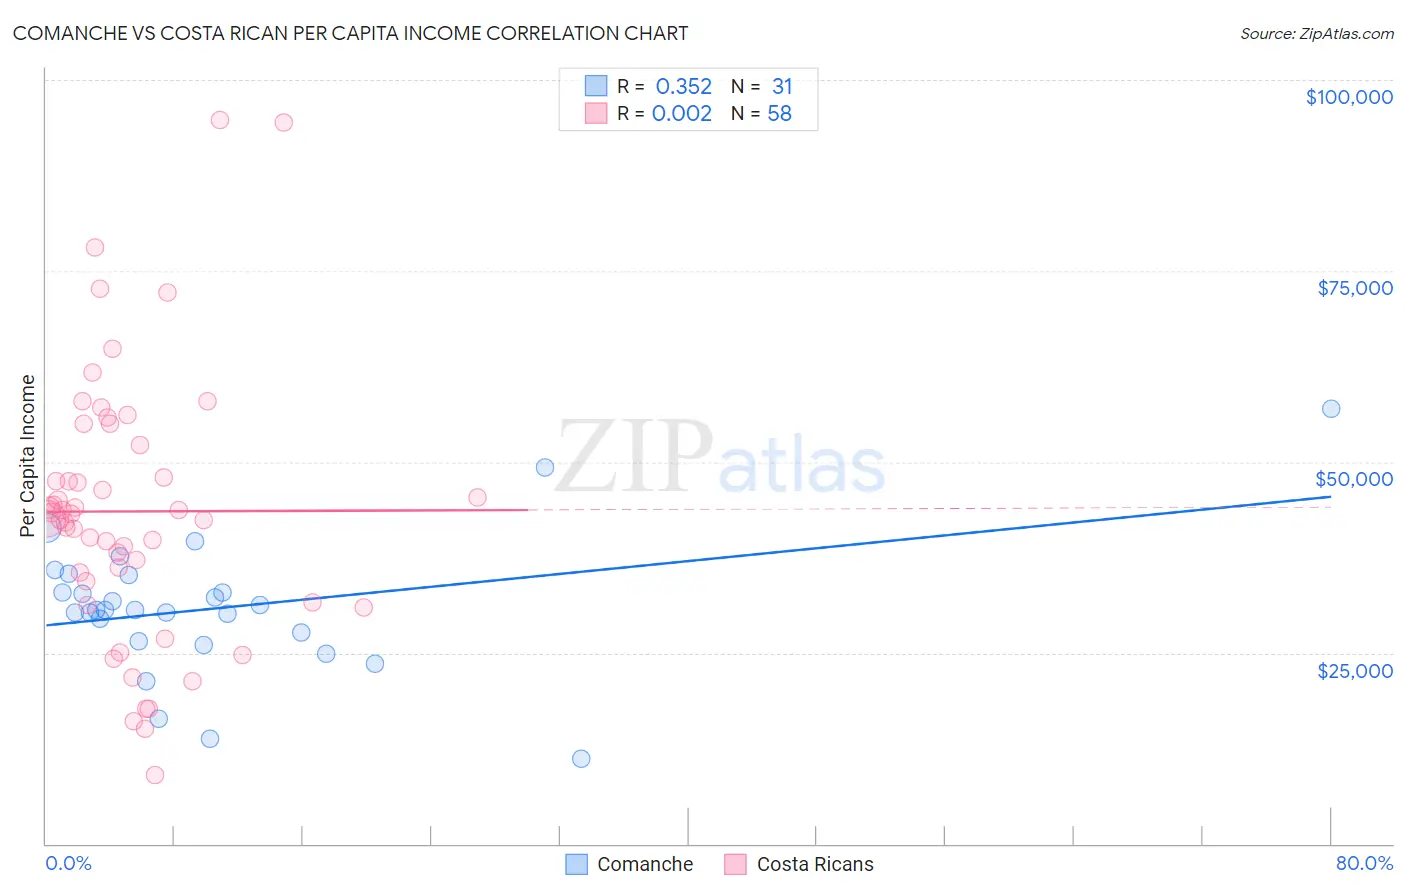
Comanche vs Costa Rican Per Capita Income Correlation Chart
The statistical analysis conducted on geographies consisting of 109,786,530 people shows a mild positive correlation between the proportion of Comanche and per capita income in the United States with a correlation coefficient (R) of 0.352 and weighted average of $38,088. Similarly, the statistical analysis conducted on geographies consisting of 253,595,957 people shows no correlation between the proportion of Costa Ricans and per capita income in the United States with a correlation coefficient (R) of 0.002 and weighted average of $44,090, a difference of 15.8%.
Per Capita Income Correlation Summary
| Measurement | Comanche | Costa Rican |
| Minimum | $11,178 | $9,066 |
| Maximum | $56,980 | $94,709 |
| Range | $45,802 | $85,643 |
| Mean | $30,910 | $43,514 |
| Median | $30,680 | $42,885 |
| Interquartile 25% (IQ1) | $26,547 | $34,433 |
| Interquartile 75% (IQ3) | $35,132 | $52,139 |
| Interquartile Range (IQR) | $8,585 | $17,706 |
| Standard Deviation (Sample) | $9,053 | $17,472 |
| Standard Deviation (Population) | $8,906 | $17,321 |
Similar Demographics by Per Capita Income
Demographics Similar to Comanche by Per Capita Income
In terms of per capita income, the demographic groups most similar to Comanche are Immigrants from Nicaragua ($38,065, a difference of 0.060%), Hmong ($38,120, a difference of 0.080%), Colville ($38,047, a difference of 0.11%), Potawatomi ($38,046, a difference of 0.11%), and Immigrants from Liberia ($38,165, a difference of 0.20%).
| Demographics | Rating | Rank | Per Capita Income |
| Immigrants | Belize | 0.3 /100 | #270 | Tragic $38,614 |
| Central Americans | 0.3 /100 | #271 | Tragic $38,560 |
| Immigrants | Cabo Verde | 0.3 /100 | #272 | Tragic $38,540 |
| Nepalese | 0.3 /100 | #273 | Tragic $38,442 |
| Immigrants | El Salvador | 0.3 /100 | #274 | Tragic $38,394 |
| Immigrants | Liberia | 0.2 /100 | #275 | Tragic $38,165 |
| Hmong | 0.2 /100 | #276 | Tragic $38,120 |
| Comanche | 0.2 /100 | #277 | Tragic $38,088 |
| Immigrants | Nicaragua | 0.2 /100 | #278 | Tragic $38,065 |
| Colville | 0.2 /100 | #279 | Tragic $38,047 |
| Potawatomi | 0.2 /100 | #280 | Tragic $38,046 |
| Immigrants | Dominica | 0.2 /100 | #281 | Tragic $37,952 |
| Immigrants | Laos | 0.1 /100 | #282 | Tragic $37,857 |
| Pennsylvania Germans | 0.1 /100 | #283 | Tragic $37,842 |
| Africans | 0.1 /100 | #284 | Tragic $37,785 |
Demographics Similar to Costa Ricans by Per Capita Income
In terms of per capita income, the demographic groups most similar to Costa Ricans are Danish ($44,095, a difference of 0.010%), Swiss ($44,076, a difference of 0.030%), South American ($44,114, a difference of 0.050%), Immigrants from South America ($44,068, a difference of 0.050%), and Sri Lankan ($44,014, a difference of 0.17%).
| Demographics | Rating | Rank | Per Capita Income |
| Portuguese | 68.7 /100 | #154 | Good $44,362 |
| Uruguayans | 67.6 /100 | #155 | Good $44,318 |
| Slovaks | 65.4 /100 | #156 | Good $44,229 |
| South American Indians | 64.8 /100 | #157 | Good $44,206 |
| Immigrants | Nepal | 64.3 /100 | #158 | Good $44,187 |
| South Americans | 62.4 /100 | #159 | Good $44,114 |
| Danes | 61.9 /100 | #160 | Good $44,095 |
| Costa Ricans | 61.8 /100 | #161 | Good $44,090 |
| Swiss | 61.4 /100 | #162 | Good $44,076 |
| Immigrants | South America | 61.2 /100 | #163 | Good $44,068 |
| Sri Lankans | 59.8 /100 | #164 | Average $44,014 |
| Immigrants | Philippines | 59.4 /100 | #165 | Average $44,000 |
| Immigrants | Uruguay | 59.3 /100 | #166 | Average $43,997 |
| English | 58.9 /100 | #167 | Average $43,982 |
| Belgians | 58.1 /100 | #168 | Average $43,951 |