Immigrants from Argentina vs Costa Rican Per Capita Income
COMPARE
Immigrants from Argentina
Costa Rican
Per Capita Income
Per Capita Income Comparison
Immigrants from Argentina
Costa Ricans
$49,627
PER CAPITA INCOME
99.9/ 100
METRIC RATING
64th/ 347
METRIC RANK
$44,090
PER CAPITA INCOME
61.8/ 100
METRIC RATING
161st/ 347
METRIC RANK
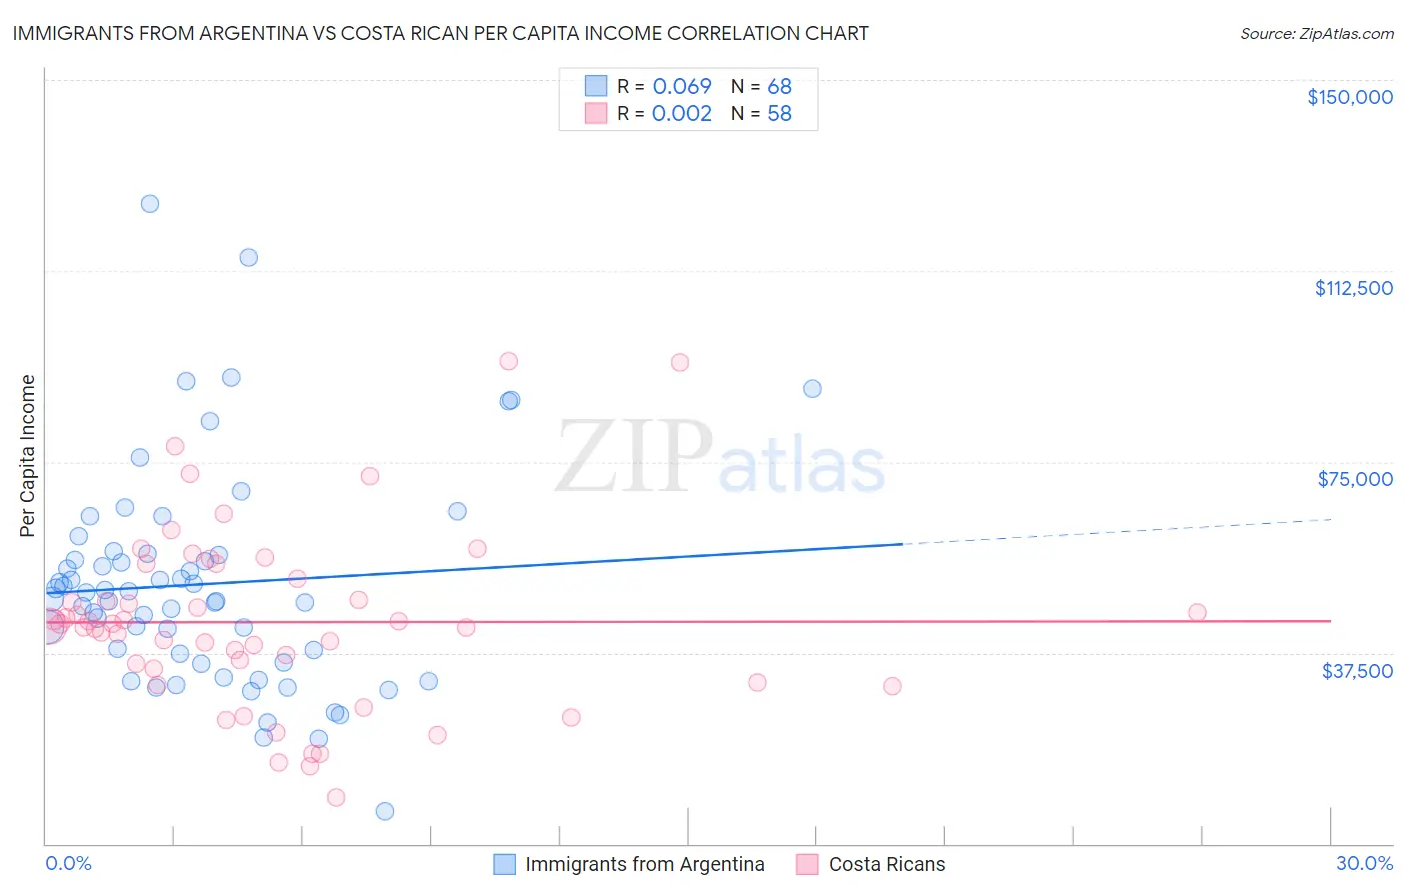
Immigrants from Argentina vs Costa Rican Per Capita Income Correlation Chart
The statistical analysis conducted on geographies consisting of 264,438,412 people shows a slight positive correlation between the proportion of Immigrants from Argentina and per capita income in the United States with a correlation coefficient (R) of 0.069 and weighted average of $49,627. Similarly, the statistical analysis conducted on geographies consisting of 253,595,957 people shows no correlation between the proportion of Costa Ricans and per capita income in the United States with a correlation coefficient (R) of 0.002 and weighted average of $44,090, a difference of 12.6%.
Per Capita Income Correlation Summary
| Measurement | Immigrants from Argentina | Costa Rican |
| Minimum | $6,333 | $9,066 |
| Maximum | $125,688 | $94,709 |
| Range | $119,355 | $85,643 |
| Mean | $51,000 | $43,514 |
| Median | $48,720 | $42,885 |
| Interquartile 25% (IQ1) | $36,471 | $34,433 |
| Interquartile 75% (IQ3) | $56,811 | $52,139 |
| Interquartile Range (IQR) | $20,340 | $17,706 |
| Standard Deviation (Sample) | $21,495 | $17,472 |
| Standard Deviation (Population) | $21,336 | $17,321 |
Similar Demographics by Per Capita Income
Demographics Similar to Immigrants from Argentina by Per Capita Income
In terms of per capita income, the demographic groups most similar to Immigrants from Argentina are Maltese ($49,640, a difference of 0.030%), Bolivian ($49,526, a difference of 0.20%), Immigrants from Asia ($49,741, a difference of 0.23%), Immigrants from Bulgaria ($49,482, a difference of 0.29%), and Immigrants from Romania ($49,463, a difference of 0.33%).
| Demographics | Rating | Rank | Per Capita Income |
| South Africans | 99.9 /100 | #57 | Exceptional $50,044 |
| Immigrants | Malaysia | 99.9 /100 | #58 | Exceptional $49,983 |
| Bhutanese | 99.9 /100 | #59 | Exceptional $49,894 |
| Immigrants | Scotland | 99.9 /100 | #60 | Exceptional $49,893 |
| Argentineans | 99.9 /100 | #61 | Exceptional $49,862 |
| Immigrants | Asia | 99.9 /100 | #62 | Exceptional $49,741 |
| Maltese | 99.9 /100 | #63 | Exceptional $49,640 |
| Immigrants | Argentina | 99.9 /100 | #64 | Exceptional $49,627 |
| Bolivians | 99.9 /100 | #65 | Exceptional $49,526 |
| Immigrants | Bulgaria | 99.9 /100 | #66 | Exceptional $49,482 |
| Immigrants | Romania | 99.9 /100 | #67 | Exceptional $49,463 |
| Lithuanians | 99.8 /100 | #68 | Exceptional $49,448 |
| Immigrants | Canada | 99.8 /100 | #69 | Exceptional $49,412 |
| Immigrants | Eastern Europe | 99.8 /100 | #70 | Exceptional $49,316 |
| Greeks | 99.8 /100 | #71 | Exceptional $49,309 |
Demographics Similar to Costa Ricans by Per Capita Income
In terms of per capita income, the demographic groups most similar to Costa Ricans are Danish ($44,095, a difference of 0.010%), Swiss ($44,076, a difference of 0.030%), South American ($44,114, a difference of 0.050%), Immigrants from South America ($44,068, a difference of 0.050%), and Sri Lankan ($44,014, a difference of 0.17%).
| Demographics | Rating | Rank | Per Capita Income |
| Portuguese | 68.7 /100 | #154 | Good $44,362 |
| Uruguayans | 67.6 /100 | #155 | Good $44,318 |
| Slovaks | 65.4 /100 | #156 | Good $44,229 |
| South American Indians | 64.8 /100 | #157 | Good $44,206 |
| Immigrants | Nepal | 64.3 /100 | #158 | Good $44,187 |
| South Americans | 62.4 /100 | #159 | Good $44,114 |
| Danes | 61.9 /100 | #160 | Good $44,095 |
| Costa Ricans | 61.8 /100 | #161 | Good $44,090 |
| Swiss | 61.4 /100 | #162 | Good $44,076 |
| Immigrants | South America | 61.2 /100 | #163 | Good $44,068 |
| Sri Lankans | 59.8 /100 | #164 | Average $44,014 |
| Immigrants | Philippines | 59.4 /100 | #165 | Average $44,000 |
| Immigrants | Uruguay | 59.3 /100 | #166 | Average $43,997 |
| English | 58.9 /100 | #167 | Average $43,982 |
| Belgians | 58.1 /100 | #168 | Average $43,951 |