Turkish vs Samoan Unemployment Among Ages 30 to 34 years
COMPARE
Turkish
Samoan
Unemployment Among Ages 30 to 34 years
Unemployment Among Ages 30 to 34 years Comparison
Turks
Samoans
5.1%
UNEMPLOYMENT AMONG AGES 30 TO 34 YEARS
98.2/ 100
METRIC RATING
51st/ 347
METRIC RANK
5.8%
UNEMPLOYMENT AMONG AGES 30 TO 34 YEARS
2.5/ 100
METRIC RATING
225th/ 347
METRIC RANK
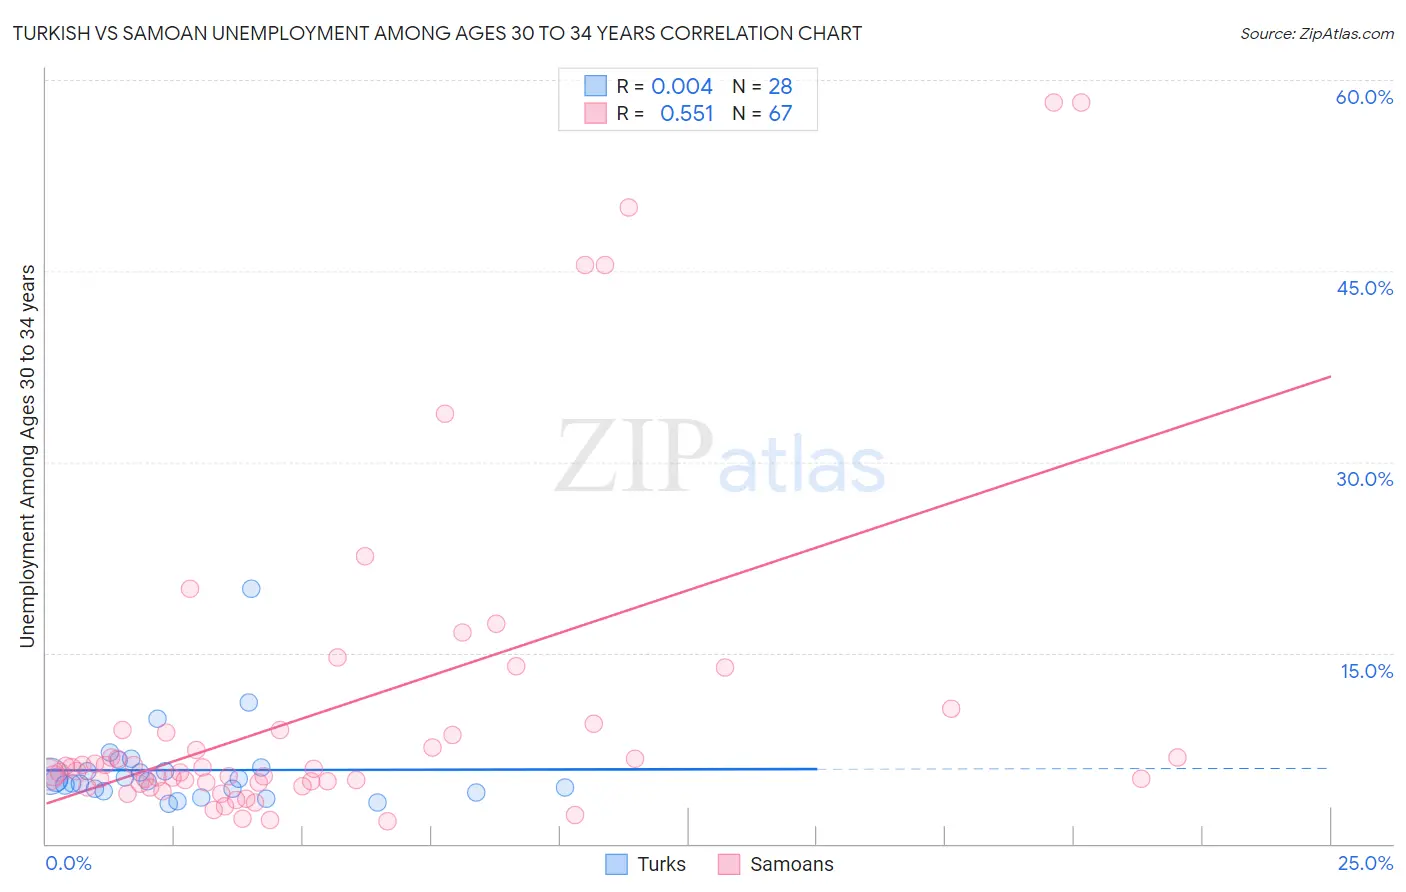
Turkish vs Samoan Unemployment Among Ages 30 to 34 years Correlation Chart
The statistical analysis conducted on geographies consisting of 260,750,898 people shows no correlation between the proportion of Turks and unemployment rate among population between the ages 30 and 34 in the United States with a correlation coefficient (R) of 0.004 and weighted average of 5.1%. Similarly, the statistical analysis conducted on geographies consisting of 218,774,829 people shows a substantial positive correlation between the proportion of Samoans and unemployment rate among population between the ages 30 and 34 in the United States with a correlation coefficient (R) of 0.551 and weighted average of 5.8%, a difference of 14.3%.
Unemployment Among Ages 30 to 34 years Correlation Summary
| Measurement | Turkish | Samoan |
| Minimum | 3.2% | 1.8% |
| Maximum | 20.0% | 58.2% |
| Range | 16.8% | 56.4% |
| Mean | 5.8% | 10.5% |
| Median | 4.9% | 5.7% |
| Interquartile 25% (IQ1) | 4.2% | 4.8% |
| Interquartile 75% (IQ3) | 5.9% | 8.9% |
| Interquartile Range (IQR) | 1.6% | 4.1% |
| Standard Deviation (Sample) | 3.3% | 12.9% |
| Standard Deviation (Population) | 3.3% | 12.8% |
Similar Demographics by Unemployment Among Ages 30 to 34 years
Demographics Similar to Turks by Unemployment Among Ages 30 to 34 years
In terms of unemployment among ages 30 to 34 years, the demographic groups most similar to Turks are Puget Sound Salish (5.1%, a difference of 0.030%), Immigrants from Burma/Myanmar (5.1%, a difference of 0.040%), Cuban (5.1%, a difference of 0.090%), Immigrants from Malaysia (5.1%, a difference of 0.11%), and Assyrian/Chaldean/Syriac (5.1%, a difference of 0.23%).
| Demographics | Rating | Rank | Unemployment Among Ages 30 to 34 years |
| Immigrants | Belgium | 98.7 /100 | #44 | Exceptional 5.1% |
| Yugoslavians | 98.6 /100 | #45 | Exceptional 5.1% |
| Immigrants | Congo | 98.4 /100 | #46 | Exceptional 5.1% |
| Cypriots | 98.4 /100 | #47 | Exceptional 5.1% |
| Assyrians/Chaldeans/Syriacs | 98.4 /100 | #48 | Exceptional 5.1% |
| Immigrants | Malaysia | 98.3 /100 | #49 | Exceptional 5.1% |
| Puget Sound Salish | 98.2 /100 | #50 | Exceptional 5.1% |
| Turks | 98.2 /100 | #51 | Exceptional 5.1% |
| Immigrants | Burma/Myanmar | 98.1 /100 | #52 | Exceptional 5.1% |
| Cubans | 98.1 /100 | #53 | Exceptional 5.1% |
| Immigrants | Morocco | 97.9 /100 | #54 | Exceptional 5.1% |
| Chinese | 97.7 /100 | #55 | Exceptional 5.1% |
| Immigrants | Serbia | 97.4 /100 | #56 | Exceptional 5.1% |
| Immigrants | China | 97.2 /100 | #57 | Exceptional 5.1% |
| Asians | 97.2 /100 | #58 | Exceptional 5.1% |
Demographics Similar to Samoans by Unemployment Among Ages 30 to 34 years
In terms of unemployment among ages 30 to 34 years, the demographic groups most similar to Samoans are Slovak (5.8%, a difference of 0.030%), Liberian (5.8%, a difference of 0.13%), Bermudan (5.8%, a difference of 0.17%), Spaniard (5.8%, a difference of 0.44%), and Spanish (5.8%, a difference of 0.47%).
| Demographics | Rating | Rank | Unemployment Among Ages 30 to 34 years |
| Panamanians | 4.5 /100 | #218 | Tragic 5.8% |
| French Canadians | 4.4 /100 | #219 | Tragic 5.8% |
| Sierra Leoneans | 3.9 /100 | #220 | Tragic 5.8% |
| Guamanians/Chamorros | 3.9 /100 | #221 | Tragic 5.8% |
| Spaniards | 3.2 /100 | #222 | Tragic 5.8% |
| Bermudans | 2.7 /100 | #223 | Tragic 5.8% |
| Slovaks | 2.5 /100 | #224 | Tragic 5.8% |
| Samoans | 2.5 /100 | #225 | Tragic 5.8% |
| Liberians | 2.3 /100 | #226 | Tragic 5.8% |
| Spanish | 1.8 /100 | #227 | Tragic 5.8% |
| Immigrants | Bahamas | 1.8 /100 | #228 | Tragic 5.8% |
| Immigrants | Uzbekistan | 1.5 /100 | #229 | Tragic 5.9% |
| Hawaiians | 1.2 /100 | #230 | Tragic 5.9% |
| Japanese | 1.1 /100 | #231 | Tragic 5.9% |
| Iroquois | 1.0 /100 | #232 | Tragic 5.9% |