Cree vs Immigrants from Singapore Median Earnings
COMPARE
Cree
Immigrants from Singapore
Median Earnings
Median Earnings Comparison
Cree
Immigrants from Singapore
$42,777
MEDIAN EARNINGS
0.6/ 100
METRIC RATING
267th/ 347
METRIC RANK
$59,038
MEDIAN EARNINGS
100.0/ 100
METRIC RATING
6th/ 347
METRIC RANK
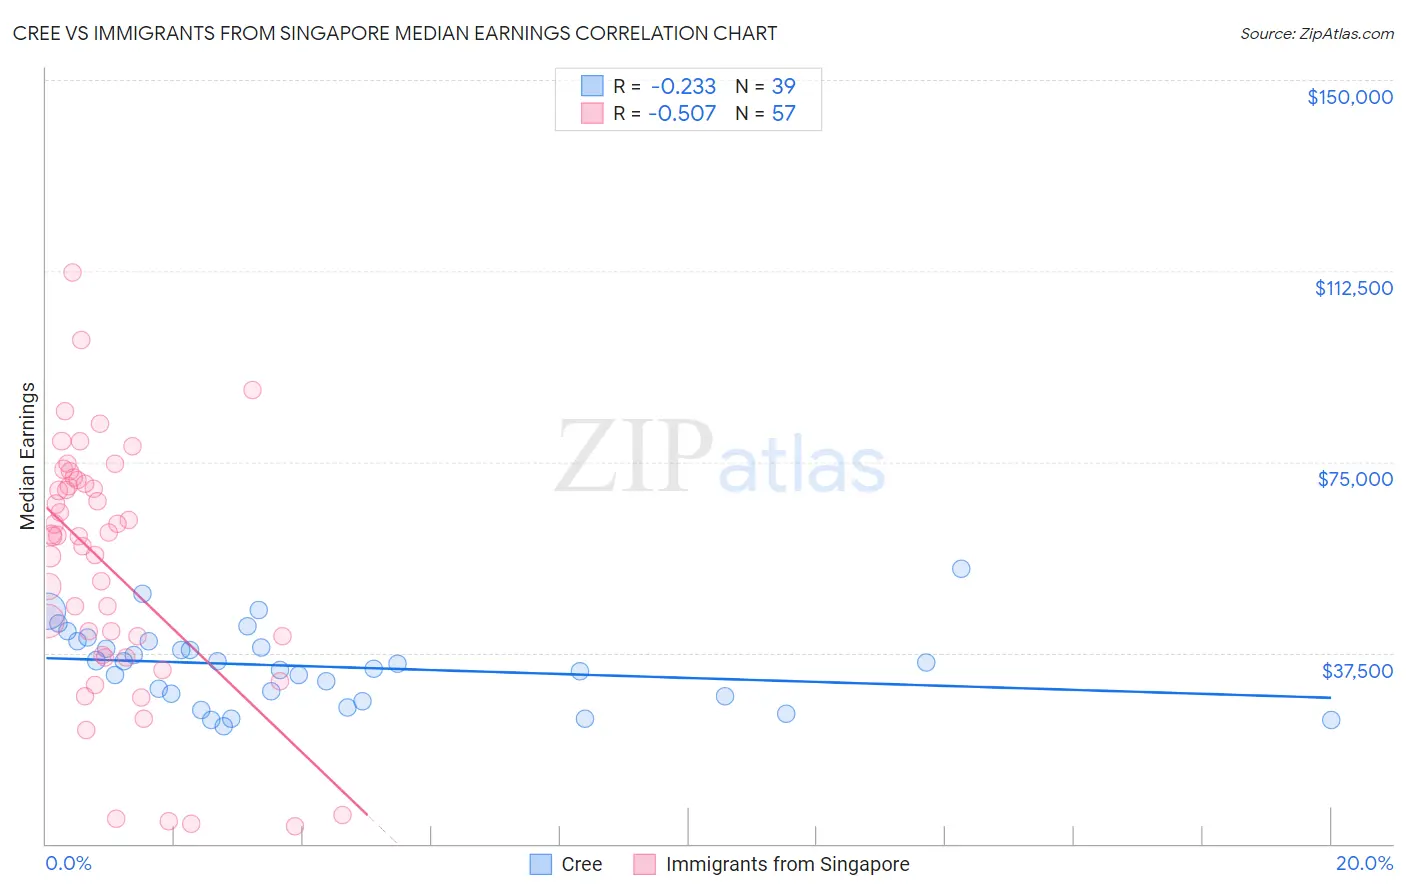
Cree vs Immigrants from Singapore Median Earnings Correlation Chart
The statistical analysis conducted on geographies consisting of 76,210,467 people shows a weak negative correlation between the proportion of Cree and median earnings in the United States with a correlation coefficient (R) of -0.233 and weighted average of $42,777. Similarly, the statistical analysis conducted on geographies consisting of 137,505,488 people shows a substantial negative correlation between the proportion of Immigrants from Singapore and median earnings in the United States with a correlation coefficient (R) of -0.507 and weighted average of $59,038, a difference of 38.0%.
Median Earnings Correlation Summary
| Measurement | Cree | Immigrants from Singapore |
| Minimum | $23,200 | $3,412 |
| Maximum | $53,900 | $112,087 |
| Range | $30,700 | $108,675 |
| Mean | $34,814 | $54,277 |
| Median | $35,233 | $60,355 |
| Interquartile 25% (IQ1) | $28,896 | $36,759 |
| Interquartile 75% (IQ3) | $39,775 | $71,145 |
| Interquartile Range (IQR) | $10,879 | $34,386 |
| Standard Deviation (Sample) | $7,415 | $24,368 |
| Standard Deviation (Population) | $7,320 | $24,153 |
Similar Demographics by Median Earnings
Demographics Similar to Cree by Median Earnings
In terms of median earnings, the demographic groups most similar to Cree are American ($42,742, a difference of 0.080%), Belizean ($42,702, a difference of 0.17%), Immigrants from Laos ($42,884, a difference of 0.25%), Osage ($42,651, a difference of 0.29%), and Salvadoran ($42,912, a difference of 0.32%).
| Demographics | Rating | Rank | Median Earnings |
| Immigrants | Somalia | 0.9 /100 | #260 | Tragic $43,100 |
| Immigrants | Jamaica | 0.8 /100 | #261 | Tragic $43,026 |
| Nicaraguans | 0.8 /100 | #262 | Tragic $43,026 |
| Inupiat | 0.8 /100 | #263 | Tragic $43,000 |
| Immigrants | Liberia | 0.7 /100 | #264 | Tragic $42,923 |
| Salvadorans | 0.7 /100 | #265 | Tragic $42,912 |
| Immigrants | Laos | 0.7 /100 | #266 | Tragic $42,884 |
| Cree | 0.6 /100 | #267 | Tragic $42,777 |
| Americans | 0.6 /100 | #268 | Tragic $42,742 |
| Belizeans | 0.5 /100 | #269 | Tragic $42,702 |
| Osage | 0.5 /100 | #270 | Tragic $42,651 |
| Pennsylvania Germans | 0.5 /100 | #271 | Tragic $42,615 |
| Iroquois | 0.4 /100 | #272 | Tragic $42,430 |
| Immigrants | Dominica | 0.4 /100 | #273 | Tragic $42,420 |
| Immigrants | El Salvador | 0.4 /100 | #274 | Tragic $42,413 |
Demographics Similar to Immigrants from Singapore by Median Earnings
In terms of median earnings, the demographic groups most similar to Immigrants from Singapore are Thai ($59,237, a difference of 0.34%), Immigrants from Hong Kong ($59,433, a difference of 0.67%), Iranian ($58,474, a difference of 0.97%), Immigrants from Iran ($57,612, a difference of 2.5%), and Okinawan ($57,550, a difference of 2.6%).
| Demographics | Rating | Rank | Median Earnings |
| Filipinos | 100.0 /100 | #1 | Exceptional $61,197 |
| Immigrants | Taiwan | 100.0 /100 | #2 | Exceptional $61,151 |
| Immigrants | India | 100.0 /100 | #3 | Exceptional $60,648 |
| Immigrants | Hong Kong | 100.0 /100 | #4 | Exceptional $59,433 |
| Thais | 100.0 /100 | #5 | Exceptional $59,237 |
| Immigrants | Singapore | 100.0 /100 | #6 | Exceptional $59,038 |
| Iranians | 100.0 /100 | #7 | Exceptional $58,474 |
| Immigrants | Iran | 100.0 /100 | #8 | Exceptional $57,612 |
| Okinawans | 100.0 /100 | #9 | Exceptional $57,550 |
| Immigrants | South Central Asia | 100.0 /100 | #10 | Exceptional $57,114 |
| Immigrants | Israel | 100.0 /100 | #11 | Exceptional $57,034 |
| Immigrants | Ireland | 100.0 /100 | #12 | Exceptional $56,854 |
| Immigrants | China | 100.0 /100 | #13 | Exceptional $56,638 |
| Immigrants | Australia | 100.0 /100 | #14 | Exceptional $56,305 |
| Indians (Asian) | 100.0 /100 | #15 | Exceptional $56,253 |