Immigrants from West Indies vs Immigrants from Singapore Median Earnings
COMPARE
Immigrants from West Indies
Immigrants from Singapore
Median Earnings
Median Earnings Comparison
Immigrants from West Indies
Immigrants from Singapore
$43,989
MEDIAN EARNINGS
3.1/ 100
METRIC RATING
246th/ 347
METRIC RANK
$59,038
MEDIAN EARNINGS
100.0/ 100
METRIC RATING
6th/ 347
METRIC RANK
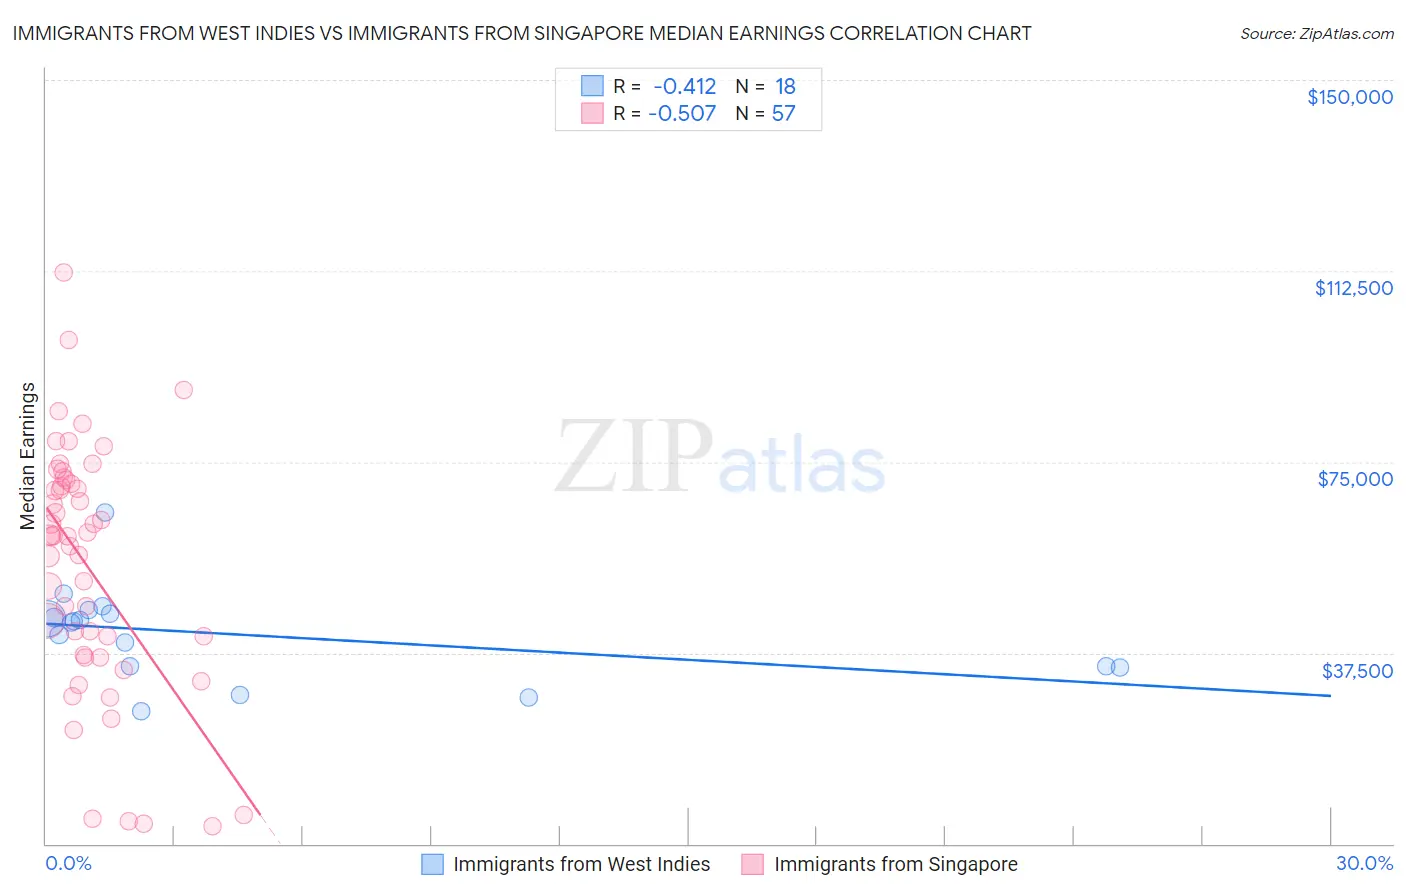
Immigrants from West Indies vs Immigrants from Singapore Median Earnings Correlation Chart
The statistical analysis conducted on geographies consisting of 72,420,477 people shows a moderate negative correlation between the proportion of Immigrants from West Indies and median earnings in the United States with a correlation coefficient (R) of -0.412 and weighted average of $43,989. Similarly, the statistical analysis conducted on geographies consisting of 137,505,488 people shows a substantial negative correlation between the proportion of Immigrants from Singapore and median earnings in the United States with a correlation coefficient (R) of -0.507 and weighted average of $59,038, a difference of 34.2%.
Median Earnings Correlation Summary
| Measurement | Immigrants from West Indies | Immigrants from Singapore |
| Minimum | $26,000 | $3,412 |
| Maximum | $64,982 | $112,087 |
| Range | $38,982 | $108,675 |
| Mean | $41,111 | $54,277 |
| Median | $43,487 | $60,355 |
| Interquartile 25% (IQ1) | $34,810 | $36,759 |
| Interquartile 75% (IQ3) | $45,119 | $71,145 |
| Interquartile Range (IQR) | $10,309 | $34,386 |
| Standard Deviation (Sample) | $9,035 | $24,368 |
| Standard Deviation (Population) | $8,780 | $24,153 |
Similar Demographics by Median Earnings
Demographics Similar to Immigrants from West Indies by Median Earnings
In terms of median earnings, the demographic groups most similar to Immigrants from West Indies are Immigrants from Burma/Myanmar ($43,998, a difference of 0.020%), Immigrants from Cabo Verde ($43,963, a difference of 0.060%), Subsaharan African ($44,118, a difference of 0.29%), Nonimmigrants ($44,117, a difference of 0.29%), and Nepalese ($43,860, a difference of 0.29%).
| Demographics | Rating | Rank | Median Earnings |
| Senegalese | 5.3 /100 | #239 | Tragic $44,373 |
| Aleuts | 4.4 /100 | #240 | Tragic $44,241 |
| Samoans | 4.2 /100 | #241 | Tragic $44,206 |
| Immigrants | Venezuela | 4.0 /100 | #242 | Tragic $44,163 |
| Sub-Saharan Africans | 3.7 /100 | #243 | Tragic $44,118 |
| Immigrants | Nonimmigrants | 3.7 /100 | #244 | Tragic $44,117 |
| Immigrants | Burma/Myanmar | 3.2 /100 | #245 | Tragic $43,998 |
| Immigrants | West Indies | 3.1 /100 | #246 | Tragic $43,989 |
| Immigrants | Cabo Verde | 3.0 /100 | #247 | Tragic $43,963 |
| Nepalese | 2.6 /100 | #248 | Tragic $43,860 |
| Malaysians | 2.6 /100 | #249 | Tragic $43,844 |
| Alaska Natives | 2.3 /100 | #250 | Tragic $43,750 |
| Tsimshian | 2.1 /100 | #251 | Tragic $43,695 |
| Hawaiians | 2.0 /100 | #252 | Tragic $43,673 |
| Somalis | 1.8 /100 | #253 | Tragic $43,567 |
Demographics Similar to Immigrants from Singapore by Median Earnings
In terms of median earnings, the demographic groups most similar to Immigrants from Singapore are Thai ($59,237, a difference of 0.34%), Immigrants from Hong Kong ($59,433, a difference of 0.67%), Iranian ($58,474, a difference of 0.97%), Immigrants from Iran ($57,612, a difference of 2.5%), and Okinawan ($57,550, a difference of 2.6%).
| Demographics | Rating | Rank | Median Earnings |
| Filipinos | 100.0 /100 | #1 | Exceptional $61,197 |
| Immigrants | Taiwan | 100.0 /100 | #2 | Exceptional $61,151 |
| Immigrants | India | 100.0 /100 | #3 | Exceptional $60,648 |
| Immigrants | Hong Kong | 100.0 /100 | #4 | Exceptional $59,433 |
| Thais | 100.0 /100 | #5 | Exceptional $59,237 |
| Immigrants | Singapore | 100.0 /100 | #6 | Exceptional $59,038 |
| Iranians | 100.0 /100 | #7 | Exceptional $58,474 |
| Immigrants | Iran | 100.0 /100 | #8 | Exceptional $57,612 |
| Okinawans | 100.0 /100 | #9 | Exceptional $57,550 |
| Immigrants | South Central Asia | 100.0 /100 | #10 | Exceptional $57,114 |
| Immigrants | Israel | 100.0 /100 | #11 | Exceptional $57,034 |
| Immigrants | Ireland | 100.0 /100 | #12 | Exceptional $56,854 |
| Immigrants | China | 100.0 /100 | #13 | Exceptional $56,638 |
| Immigrants | Australia | 100.0 /100 | #14 | Exceptional $56,305 |
| Indians (Asian) | 100.0 /100 | #15 | Exceptional $56,253 |