Australian vs Immigrants from Singapore Median Earnings

COMPARE

Australian
Race
Ancestry
AfghanAfricanAlaska NativeAlaskan AthabascanAlbanianAleutAlsatianAmericanApacheArabArapahoArgentineanArmenianAssyrian/Chaldean/SyriacAustralianAustrianBahamianBangladeshiBarbadianBasqueBelgianBelizeanBermudanBhutaneseBlackfeetBolivianBrazilianBritishBritish West IndianBulgarianBurmeseCajunCambodianCanadianCape VerdeanCarpatho RusynCelticCentral AmericanCentral American IndianCherokeeCheyenneChickasawChileanChineseChippewaChoctawColombianColvilleComancheCosta RicanCreeCreekCroatianCrowCubanCypriotCzechCzechoslovakianDanishDelawareDominicanDutchDutch West IndianEastern EuropeanEcuadorianEgyptianEnglishEstonianEthiopianEuropeanFijianFilipinoFinnishFrenchFrench American IndianFrench CanadianGermanGerman RussianGhanaianGreekGuamanian/ChamorroGuatemalanGuyaneseHaitianHmongHonduranHopiHoumaHungarianIcelanderIndian (Asian)IndonesianInupiatIranianIraqiIrishIroquoisIsraeliItalianJamaicanJapaneseJordanianKenyanKiowaKoreanLaotianLatvianLebaneseLiberianLithuanianLumbeeLuxembourgerMacedonianMalaysianMalteseMarshalleseMenomineeMexicanMexican American IndianMongolianMoroccanNative HawaiianNavajoNepaleseNew ZealanderNicaraguanNigerianNorthern EuropeanNorwegianOkinawanOsageOttawaPaiutePakistaniPalestinianPanamanianParaguayanPennsylvania GermanPeruvianPimaPolishPortuguesePotawatomiPuebloPuerto RicanPuget Sound SalishRomanianRussianSalvadoranSamoanScandinavianScotch-IrishScottishSeminoleSenegaleseSerbianShoshoneSierra LeoneanSiouxSlavicSlovakSloveneSomaliSouth AfricanSouth AmericanSouth American IndianSoviet UnionSpaniardSpanishSpanish AmericanSpanish American IndianSri LankanSubsaharan AfricanSudaneseSwedishSwissSyrianTaiwaneseThaiTlingit-HaidaTohono O'OdhamTonganTrinidadian and TobagonianTsimshianTurkishU.S. Virgin IslanderUgandanUkrainianUruguayanUteVenezuelanVietnameseWelshWest IndianYakamaYaquiYugoslavianYumanYup'ikZimbabwean
Immigration
NonimmigrantsImmigrantsAfghanistanAfricaAlbaniaArgentinaArmeniaAsiaAustraliaAustriaBahamasBangladeshBarbadosBelarusBelgiumBelizeBoliviaBosnia and HerzegovinaBrazilBulgariaBurma/MyanmarCabo VerdeCambodiaCameroonCanadaCaribbeanCentral AmericaChileChinaColombiaCongoCosta RicaCroatiaCubaCzechoslovakiaDenmarkDominicaDominican RepublicEastern AfricaEastern AsiaEastern EuropeEcuadorEgyptEl SalvadorEnglandEritreaEthiopiaEuropeFijiFranceGermanyGhanaGreeceGrenadaGuatemalaGuyanaHaitiHondurasHong KongHungaryIndiaIndonesiaIranIraqIrelandIsraelItalyJamaicaJapanJordanKazakhstanKenyaKoreaKuwaitLaosLatin AmericaLatviaLebanonLiberiaLithuaniaMalaysiaMexicoMicronesiaMiddle AfricaMoldovaMoroccoNepalNetherlandsNicaraguaNigeriaNorth AmericaNorth MacedoniaNorthern AfricaNorthern EuropeNorwayOceaniaPakistanPanamaPeruPhilippinesPolandPortugalRomaniaRussiaSaudi ArabiaScotlandSenegalSerbiaSierra LeoneSomaliaSouth AfricaSouth AmericaSouth Central AsiaSouth Eastern AsiaSouthern EuropeSpainSri LankaSt. Vincent and the GrenadinesSudanSwedenSwitzerlandSyriaTaiwanThailandTrinidad and TobagoTurkeyUgandaUkraineUruguayUzbekistanVenezuelaVietnamWest IndiesWestern AfricaWestern AsiaWestern EuropeYemenZaireZimbabweAzores
Immigrants from Singapore
Race
Ancestry
AfghanAfricanAlaska NativeAlaskan AthabascanAlbanianAleutAlsatianAmericanApacheArabArapahoArgentineanArmenianAssyrian/Chaldean/SyriacAustrianBahamianBangladeshiBarbadianBasqueBelgianBelizeanBermudanBhutaneseBlackfeetBolivianBrazilianBritishBritish West IndianBulgarianBurmeseCajunCambodianCanadianCape VerdeanCarpatho RusynCelticCentral AmericanCentral American IndianCherokeeCheyenneChickasawChileanChineseChippewaChoctawColombianColvilleComancheCosta RicanCreeCreekCroatianCrowCubanCypriotCzechCzechoslovakianDanishDelawareDominicanDutchDutch West IndianEastern EuropeanEcuadorianEgyptianEnglishEstonianEthiopianEuropeanFijianFilipinoFinnishFrenchFrench American IndianFrench CanadianGermanGerman RussianGhanaianGreekGuamanian/ChamorroGuatemalanGuyaneseHaitianHmongHonduranHopiHoumaHungarianIcelanderIndian (Asian)IndonesianInupiatIranianIraqiIrishIroquoisIsraeliItalianJamaicanJapaneseJordanianKenyanKiowaKoreanLaotianLatvianLebaneseLiberianLithuanianLumbeeLuxembourgerMacedonianMalaysianMalteseMarshalleseMenomineeMexicanMexican American IndianMongolianMoroccanNative HawaiianNavajoNepaleseNew ZealanderNicaraguanNigerianNorthern EuropeanNorwegianOkinawanOsageOttawaPaiutePakistaniPalestinianPanamanianParaguayanPennsylvania GermanPeruvianPimaPolishPortuguesePotawatomiPuebloPuerto RicanPuget Sound SalishRomanianRussianSalvadoranSamoanScandinavianScotch-IrishScottishSeminoleSenegaleseSerbianShoshoneSierra LeoneanSiouxSlavicSlovakSloveneSomaliSouth AfricanSouth AmericanSouth American IndianSoviet UnionSpaniardSpanishSpanish AmericanSpanish American IndianSri LankanSubsaharan AfricanSudaneseSwedishSwissSyrianTaiwaneseThaiTlingit-HaidaTohono O'OdhamTonganTrinidadian and TobagonianTsimshianTurkishU.S. Virgin IslanderUgandanUkrainianUruguayanUteVenezuelanVietnameseWelshWest IndianYakamaYaquiYugoslavianYumanYup'ikZimbabwean
Immigration
NonimmigrantsImmigrantsAfghanistanAfricaAlbaniaArgentinaArmeniaAsiaAustraliaAustriaBahamasBangladeshBarbadosBelarusBelgiumBelizeBoliviaBosnia and HerzegovinaBrazilBulgariaBurma/MyanmarCabo VerdeCambodiaCameroonCanadaCaribbeanCentral AmericaChileChinaColombiaCongoCosta RicaCroatiaCubaCzechoslovakiaDenmarkDominicaDominican RepublicEastern AfricaEastern AsiaEastern EuropeEcuadorEgyptEl SalvadorEnglandEritreaEthiopiaEuropeFijiFranceGermanyGhanaGreeceGrenadaGuatemalaGuyanaHaitiHondurasHong KongHungaryIndiaIndonesiaIranIraqIrelandIsraelItalyJamaicaJapanJordanKazakhstanKenyaKoreaKuwaitLaosLatin AmericaLatviaLebanonLiberiaLithuaniaMalaysiaMexicoMicronesiaMiddle AfricaMoldovaMoroccoNepalNetherlandsNicaraguaNigeriaNorth AmericaNorth MacedoniaNorthern AfricaNorthern EuropeNorwayOceaniaPakistanPanamaPeruPhilippinesPolandPortugalRomaniaRussiaSaudi ArabiaScotlandSenegalSerbiaSierra LeoneSingaporeSomaliaSouth AfricaSouth AmericaSouth Central AsiaSouth Eastern AsiaSouthern EuropeSpainSri LankaSt. Vincent and the GrenadinesSudanSwedenSwitzerlandSyriaTaiwanThailandTrinidad and TobagoTurkeyUgandaUkraineUruguayUzbekistanVenezuelaVietnamWest IndiesWestern AfricaWestern AsiaWestern EuropeYemenZaireZimbabweAzores
Median Earnings
Income
Poverty
Unemployment
Labor Participation
Family Structure
Vehicle Availability
Education Level
Disability

Median Earnings Comparison

Australians

Immigrants from Singapore

Exceptional
Exceptional
$52,294
MEDIAN EARNINGS
100.0/ 100
METRIC RATING
47th/ 347
METRIC RANK
$59,038
MEDIAN EARNINGS
100.0/ 100
METRIC RATING
6th/ 347
METRIC RANK

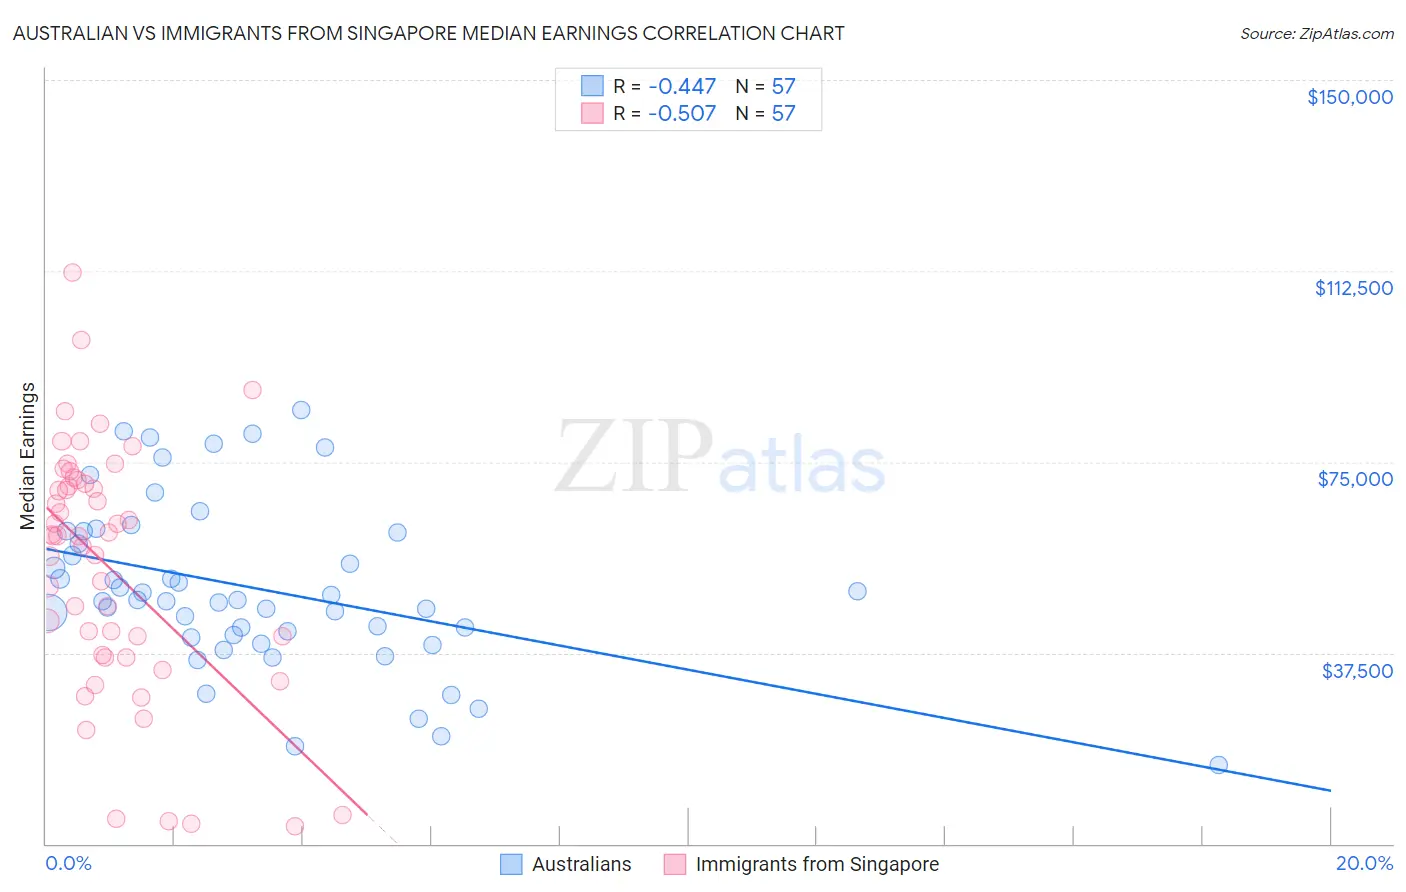
Australian vs Immigrants from Singapore Median Earnings Correlation Chart

The statistical analysis conducted on geographies consisting of 224,158,339 people shows a moderate negative correlation between the proportion of Australians and median earnings in the United States with a correlation coefficient (R) of -0.447 and weighted average of $52,294. Similarly, the statistical analysis conducted on geographies consisting of 137,505,488 people shows a substantial negative correlation between the proportion of Immigrants from Singapore and median earnings in the United States with a correlation coefficient (R) of -0.507 and weighted average of $59,038, a difference of 12.9%.
Australian vs Immigrants from Singapore Median Earnings

Median Earnings Correlation Summary

MeasurementAustralianImmigrants from Singapore
Minimum$15,451$3,412
Maximum$85,069$112,087
Range$69,618$108,675
Mean$50,151$54,277
Median$47,849$60,355
Interquartile 25% (IQ1)$40,819$36,759
Interquartile 75% (IQ3)$61,206$71,145
Interquartile Range (IQR)$20,387$34,386
Standard Deviation (Sample)$16,224$24,368
Standard Deviation (Population)$16,081$24,153

Similar Demographics by Median Earnings

Demographics Similar to Australians by Median Earnings

In terms of median earnings, the demographic groups most similar to Australians are Bhutanese ($52,297, a difference of 0.010%), Immigrants from Czechoslovakia ($52,361, a difference of 0.13%), Immigrants from Europe ($52,195, a difference of 0.19%), Immigrants from Malaysia ($52,514, a difference of 0.42%), and Bulgarian ($52,512, a difference of 0.42%).
DemographicsRating | RankMedian Earnings
Israelis
100.0
/100
|
#40
Exceptional
$52,937
Immigrants | Lithuania
100.0
/100
|
#41
Exceptional
$52,769
Maltese
100.0
/100
|
#42
Exceptional
$52,526
Immigrants | Malaysia
100.0
/100
|
#43
Exceptional
$52,514
Bulgarians
100.0
/100
|
#44
Exceptional
$52,512
Immigrants | Czechoslovakia
100.0
/100
|
#45
Exceptional
$52,361
Bhutanese
100.0
/100
|
#46
Exceptional
$52,297
Australians
100.0
/100
|
#47
Exceptional
$52,294
Immigrants | Europe
100.0
/100
|
#48
Exceptional
$52,195
Bolivians
100.0
/100
|
#49
Exceptional
$52,005
Immigrants | South Africa
100.0
/100
|
#50
Exceptional
$51,850
Immigrants | Austria
99.9
/100
|
#51
Exceptional
$51,826
Estonians
99.9
/100
|
#52
Exceptional
$51,772
Immigrants | Norway
99.9
/100
|
#53
Exceptional
$51,758
Immigrants | Indonesia
99.9
/100
|
#54
Exceptional
$51,715

Demographics Similar to Immigrants from Singapore by Median Earnings

In terms of median earnings, the demographic groups most similar to Immigrants from Singapore are Thai ($59,237, a difference of 0.34%), Immigrants from Hong Kong ($59,433, a difference of 0.67%), Iranian ($58,474, a difference of 0.97%), Immigrants from Iran ($57,612, a difference of 2.5%), and Okinawan ($57,550, a difference of 2.6%).
DemographicsRating | RankMedian Earnings
Filipinos
100.0
/100
|
#1
Exceptional
$61,197
Immigrants | Taiwan
100.0
/100
|
#2
Exceptional
$61,151
Immigrants | India
100.0
/100
|
#3
Exceptional
$60,648
Immigrants | Hong Kong
100.0
/100
|
#4
Exceptional
$59,433
Thais
100.0
/100
|
#5
Exceptional
$59,237
Immigrants | Singapore
100.0
/100
|
#6
Exceptional
$59,038
Iranians
100.0
/100
|
#7
Exceptional
$58,474
Immigrants | Iran
100.0
/100
|
#8
Exceptional
$57,612
Okinawans
100.0
/100
|
#9
Exceptional
$57,550
Immigrants | South Central Asia
100.0
/100
|
#10
Exceptional
$57,114
Immigrants | Israel
100.0
/100
|
#11
Exceptional
$57,034
Immigrants | Ireland
100.0
/100
|
#12
Exceptional
$56,854
Immigrants | China
100.0
/100
|
#13
Exceptional
$56,638
Immigrants | Australia
100.0
/100
|
#14
Exceptional
$56,305
Indians (Asian)
100.0
/100
|
#15
Exceptional
$56,253