Tsimshian vs Irish Female Unemployment
COMPARE
Tsimshian
Irish
Female Unemployment
Female Unemployment Comparison
Tsimshian
Irish
5.4%
FEMALE UNEMPLOYMENT
23.1/ 100
METRIC RATING
198th/ 347
METRIC RANK
4.7%
FEMALE UNEMPLOYMENT
99.9/ 100
METRIC RATING
28th/ 347
METRIC RANK
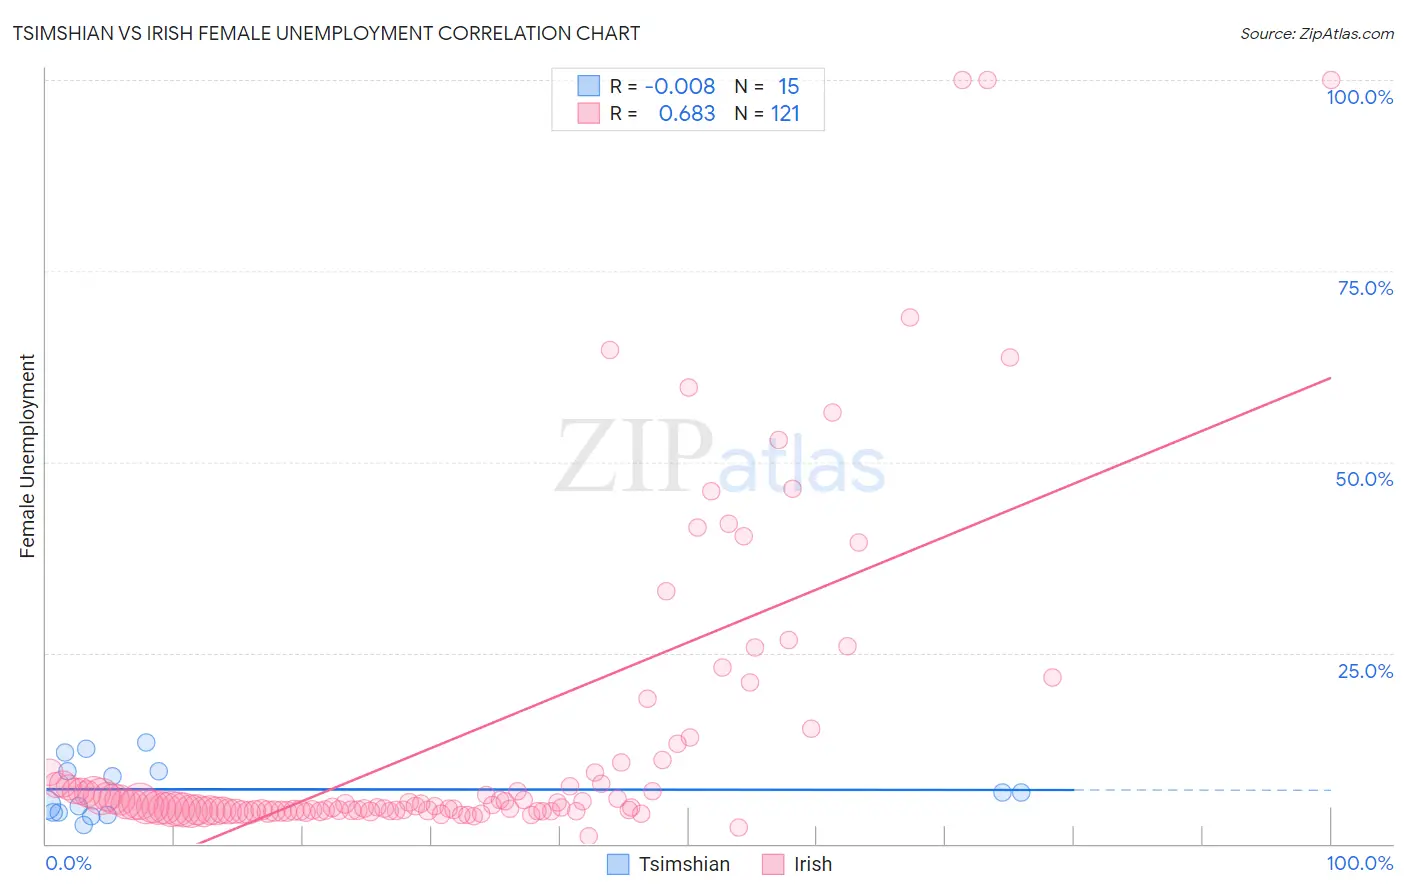
Tsimshian vs Irish Female Unemployment Correlation Chart
The statistical analysis conducted on geographies consisting of 15,620,666 people shows no correlation between the proportion of Tsimshian and unemploymnet rate among females in the United States with a correlation coefficient (R) of -0.008 and weighted average of 5.4%. Similarly, the statistical analysis conducted on geographies consisting of 563,665,883 people shows a significant positive correlation between the proportion of Irish and unemploymnet rate among females in the United States with a correlation coefficient (R) of 0.683 and weighted average of 4.7%, a difference of 13.0%.
Female Unemployment Correlation Summary
| Measurement | Tsimshian | Irish |
| Minimum | 2.4% | 1.0% |
| Maximum | 13.3% | 100.0% |
| Range | 10.9% | 99.0% |
| Mean | 7.1% | 13.6% |
| Median | 6.7% | 4.9% |
| Interquartile 25% (IQ1) | 4.0% | 4.3% |
| Interquartile 75% (IQ3) | 9.5% | 8.6% |
| Interquartile Range (IQR) | 5.5% | 4.2% |
| Standard Deviation (Sample) | 3.6% | 20.3% |
| Standard Deviation (Population) | 3.4% | 20.2% |
Similar Demographics by Female Unemployment
Demographics Similar to Tsimshian by Female Unemployment
In terms of female unemployment, the demographic groups most similar to Tsimshian are Alsatian (5.3%, a difference of 0.070%), Hawaiian (5.4%, a difference of 0.080%), Soviet Union (5.4%, a difference of 0.12%), Spaniard (5.3%, a difference of 0.17%), and Immigrants from Middle Africa (5.4%, a difference of 0.20%).
| Demographics | Rating | Rank | Female Unemployment |
| Cherokee | 30.8 /100 | #191 | Fair 5.3% |
| Portuguese | 28.6 /100 | #192 | Fair 5.3% |
| Arabs | 27.7 /100 | #193 | Fair 5.3% |
| Colombians | 27.0 /100 | #194 | Fair 5.3% |
| Immigrants | Colombia | 26.2 /100 | #195 | Fair 5.3% |
| Spaniards | 25.2 /100 | #196 | Fair 5.3% |
| Alsatians | 23.9 /100 | #197 | Fair 5.3% |
| Tsimshian | 23.1 /100 | #198 | Fair 5.4% |
| Hawaiians | 22.2 /100 | #199 | Fair 5.4% |
| Soviet Union | 21.7 /100 | #200 | Fair 5.4% |
| Immigrants | Middle Africa | 20.8 /100 | #201 | Fair 5.4% |
| Iroquois | 20.8 /100 | #202 | Fair 5.4% |
| Immigrants | South Eastern Asia | 20.3 /100 | #203 | Fair 5.4% |
| Immigrants | Israel | 19.7 /100 | #204 | Poor 5.4% |
| Immigrants | Afghanistan | 18.9 /100 | #205 | Poor 5.4% |
Demographics Similar to Irish by Female Unemployment
In terms of female unemployment, the demographic groups most similar to Irish are Cypriot (4.7%, a difference of 0.010%), British (4.7%, a difference of 0.030%), Lithuanian (4.7%, a difference of 0.13%), Immigrants from Bosnia and Herzegovina (4.7%, a difference of 0.20%), and Immigrants from India (4.7%, a difference of 0.24%).
| Demographics | Rating | Rank | Female Unemployment |
| Fijians | 99.9 /100 | #21 | Exceptional 4.7% |
| Europeans | 99.9 /100 | #22 | Exceptional 4.7% |
| Scottish | 99.9 /100 | #23 | Exceptional 4.7% |
| Welsh | 99.9 /100 | #24 | Exceptional 4.7% |
| Immigrants | India | 99.9 /100 | #25 | Exceptional 4.7% |
| Immigrants | Bosnia and Herzegovina | 99.9 /100 | #26 | Exceptional 4.7% |
| British | 99.9 /100 | #27 | Exceptional 4.7% |
| Irish | 99.9 /100 | #28 | Exceptional 4.7% |
| Cypriots | 99.9 /100 | #29 | Exceptional 4.7% |
| Lithuanians | 99.8 /100 | #30 | Exceptional 4.7% |
| Sudanese | 99.8 /100 | #31 | Exceptional 4.8% |
| Slovaks | 99.8 /100 | #32 | Exceptional 4.8% |
| Czechoslovakians | 99.7 /100 | #33 | Exceptional 4.8% |
| Zimbabweans | 99.7 /100 | #34 | Exceptional 4.8% |
| French Canadians | 99.7 /100 | #35 | Exceptional 4.8% |