New Zealander vs Immigrants from Micronesia Median Male Earnings
COMPARE
New Zealander
Immigrants from Micronesia
Median Male Earnings
Median Male Earnings Comparison
New Zealanders
Immigrants from Micronesia
$61,199
MEDIAN MALE EARNINGS
99.9/ 100
METRIC RATING
58th/ 347
METRIC RANK
$47,177
MEDIAN MALE EARNINGS
0.1/ 100
METRIC RATING
298th/ 347
METRIC RANK
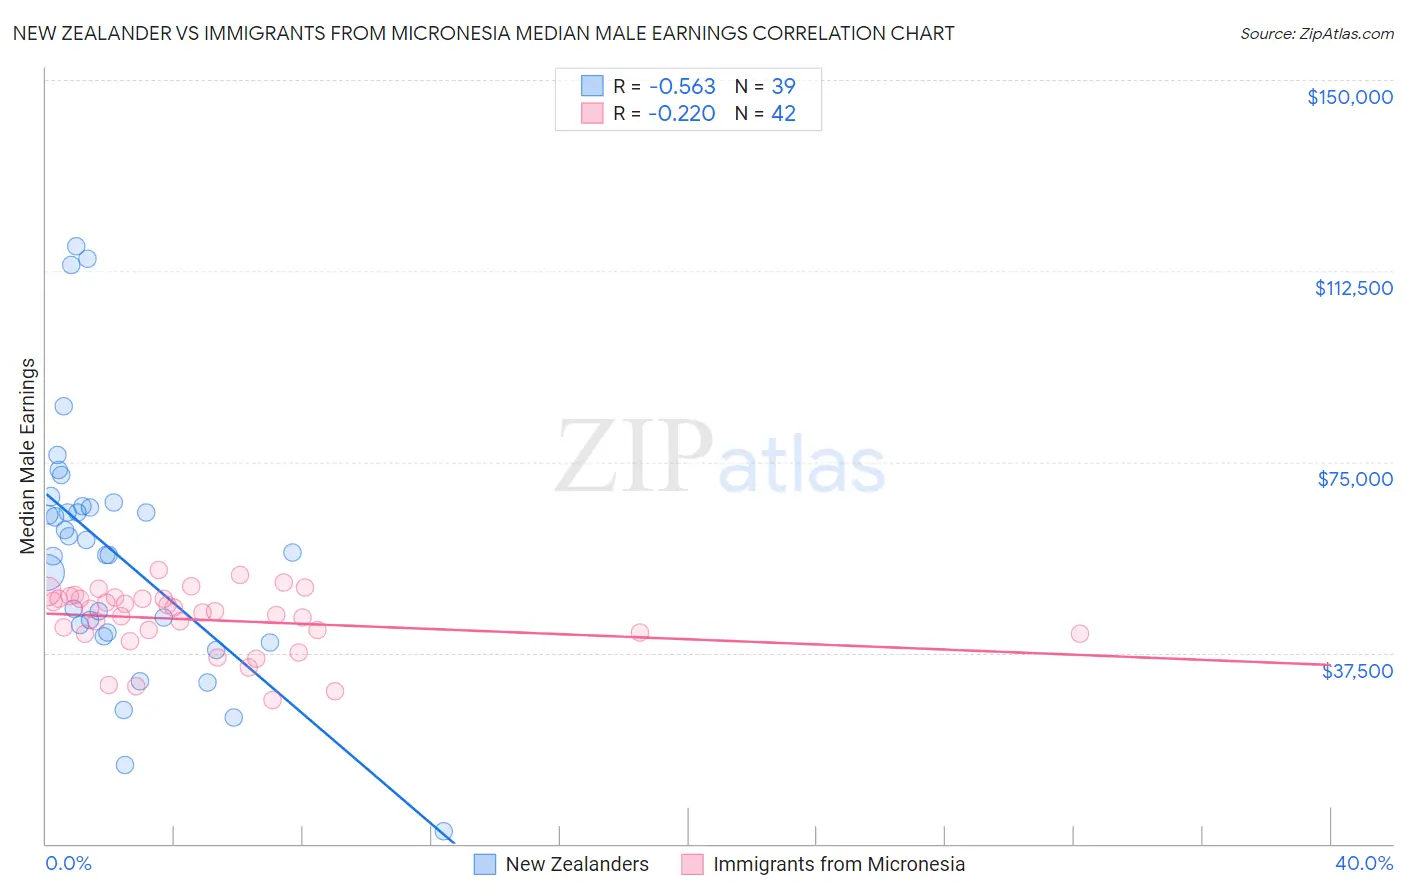
New Zealander vs Immigrants from Micronesia Median Male Earnings Correlation Chart
The statistical analysis conducted on geographies consisting of 106,908,736 people shows a substantial negative correlation between the proportion of New Zealanders and median male earnings in the United States with a correlation coefficient (R) of -0.563 and weighted average of $61,199. Similarly, the statistical analysis conducted on geographies consisting of 61,605,252 people shows a weak negative correlation between the proportion of Immigrants from Micronesia and median male earnings in the United States with a correlation coefficient (R) of -0.220 and weighted average of $47,177, a difference of 29.7%.
Median Male Earnings Correlation Summary
| Measurement | New Zealander | Immigrants from Micronesia |
| Minimum | $2,499 | $28,299 |
| Maximum | $117,445 | $53,866 |
| Range | $114,946 | $25,567 |
| Mean | $57,008 | $43,968 |
| Median | $57,308 | $45,525 |
| Interquartile 25% (IQ1) | $41,429 | $41,333 |
| Interquartile 75% (IQ3) | $66,406 | $48,203 |
| Interquartile Range (IQR) | $24,977 | $6,870 |
| Standard Deviation (Sample) | $24,372 | $6,332 |
| Standard Deviation (Population) | $24,057 | $6,257 |
Similar Demographics by Median Male Earnings
Demographics Similar to New Zealanders by Median Male Earnings
In terms of median male earnings, the demographic groups most similar to New Zealanders are Immigrants from Scotland ($61,220, a difference of 0.030%), Lithuanian ($61,228, a difference of 0.050%), Greek ($61,242, a difference of 0.070%), Immigrants from Netherlands ($61,096, a difference of 0.17%), and Egyptian ($61,095, a difference of 0.17%).
| Demographics | Rating | Rank | Median Male Earnings |
| Estonians | 99.9 /100 | #51 | Exceptional $61,710 |
| Immigrants | Norway | 99.9 /100 | #52 | Exceptional $61,628 |
| South Africans | 99.9 /100 | #53 | Exceptional $61,460 |
| Immigrants | Latvia | 99.9 /100 | #54 | Exceptional $61,422 |
| Greeks | 99.9 /100 | #55 | Exceptional $61,242 |
| Lithuanians | 99.9 /100 | #56 | Exceptional $61,228 |
| Immigrants | Scotland | 99.9 /100 | #57 | Exceptional $61,220 |
| New Zealanders | 99.9 /100 | #58 | Exceptional $61,199 |
| Immigrants | Netherlands | 99.8 /100 | #59 | Exceptional $61,096 |
| Egyptians | 99.8 /100 | #60 | Exceptional $61,095 |
| Bolivians | 99.8 /100 | #61 | Exceptional $61,066 |
| Immigrants | Romania | 99.8 /100 | #62 | Exceptional $61,040 |
| Immigrants | Pakistan | 99.8 /100 | #63 | Exceptional $60,987 |
| Immigrants | Eastern Europe | 99.8 /100 | #64 | Exceptional $60,958 |
| Immigrants | Indonesia | 99.8 /100 | #65 | Exceptional $60,935 |
Demographics Similar to Immigrants from Micronesia by Median Male Earnings
In terms of median male earnings, the demographic groups most similar to Immigrants from Micronesia are Dominican ($47,204, a difference of 0.060%), Inupiat ($47,281, a difference of 0.22%), Immigrants from Zaire ($47,070, a difference of 0.23%), U.S. Virgin Islander ($47,066, a difference of 0.23%), and Immigrants from Latin America ($46,941, a difference of 0.50%).
| Demographics | Rating | Rank | Median Male Earnings |
| Choctaw | 0.1 /100 | #291 | Tragic $47,729 |
| Immigrants | Dominica | 0.1 /100 | #292 | Tragic $47,651 |
| Indonesians | 0.1 /100 | #293 | Tragic $47,503 |
| Immigrants | Nicaragua | 0.1 /100 | #294 | Tragic $47,482 |
| Central American Indians | 0.1 /100 | #295 | Tragic $47,433 |
| Inupiat | 0.1 /100 | #296 | Tragic $47,281 |
| Dominicans | 0.1 /100 | #297 | Tragic $47,204 |
| Immigrants | Micronesia | 0.1 /100 | #298 | Tragic $47,177 |
| Immigrants | Zaire | 0.1 /100 | #299 | Tragic $47,070 |
| U.S. Virgin Islanders | 0.1 /100 | #300 | Tragic $47,066 |
| Immigrants | Latin America | 0.1 /100 | #301 | Tragic $46,941 |
| Seminole | 0.1 /100 | #302 | Tragic $46,783 |
| Yaqui | 0.1 /100 | #303 | Tragic $46,777 |
| Bangladeshis | 0.1 /100 | #304 | Tragic $46,744 |
| Guatemalans | 0.0 /100 | #305 | Tragic $46,736 |