Immigrants from Australia vs Somali Per Capita Income
COMPARE
Immigrants from Australia
Somali
Per Capita Income
Per Capita Income Comparison
Immigrants from Australia
Somalis
$57,953
PER CAPITA INCOME
100.0/ 100
METRIC RATING
4th/ 347
METRIC RANK
$40,367
PER CAPITA INCOME
2.4/ 100
METRIC RATING
238th/ 347
METRIC RANK
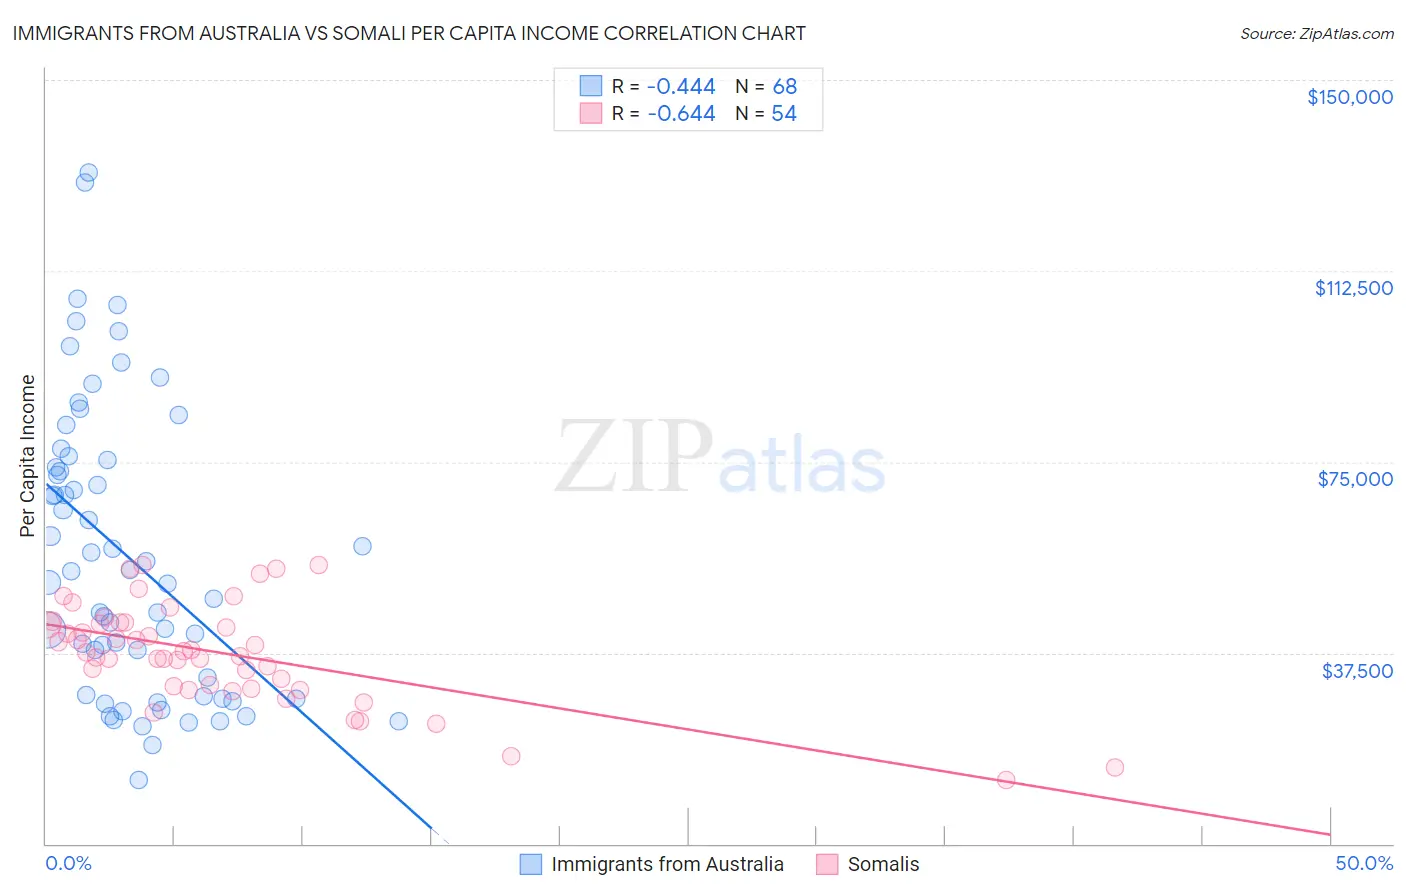
Immigrants from Australia vs Somali Per Capita Income Correlation Chart
The statistical analysis conducted on geographies consisting of 227,208,257 people shows a moderate negative correlation between the proportion of Immigrants from Australia and per capita income in the United States with a correlation coefficient (R) of -0.444 and weighted average of $57,953. Similarly, the statistical analysis conducted on geographies consisting of 99,334,522 people shows a significant negative correlation between the proportion of Somalis and per capita income in the United States with a correlation coefficient (R) of -0.644 and weighted average of $40,367, a difference of 43.6%.
Per Capita Income Correlation Summary
| Measurement | Immigrants from Australia | Somali |
| Minimum | $12,597 | $12,576 |
| Maximum | $131,905 | $54,740 |
| Range | $119,308 | $42,164 |
| Mean | $56,529 | $37,481 |
| Median | $52,474 | $37,654 |
| Interquartile 25% (IQ1) | $28,994 | $31,050 |
| Interquartile 75% (IQ3) | $74,709 | $43,455 |
| Interquartile Range (IQR) | $45,716 | $12,404 |
| Standard Deviation (Sample) | $28,217 | $9,737 |
| Standard Deviation (Population) | $28,008 | $9,647 |
Similar Demographics by Per Capita Income
Demographics Similar to Immigrants from Australia by Per Capita Income
In terms of per capita income, the demographic groups most similar to Immigrants from Australia are Immigrants from Iran ($57,759, a difference of 0.34%), Immigrants from Taiwan ($57,742, a difference of 0.37%), Immigrants from Singapore ($58,353, a difference of 0.69%), Immigrants from Israel ($57,384, a difference of 0.99%), and Iranian ($58,786, a difference of 1.4%).
| Demographics | Rating | Rank | Per Capita Income |
| Filipinos | 100.0 /100 | #1 | Exceptional $59,066 |
| Iranians | 100.0 /100 | #2 | Exceptional $58,786 |
| Immigrants | Singapore | 100.0 /100 | #3 | Exceptional $58,353 |
| Immigrants | Australia | 100.0 /100 | #4 | Exceptional $57,953 |
| Immigrants | Iran | 100.0 /100 | #5 | Exceptional $57,759 |
| Immigrants | Taiwan | 100.0 /100 | #6 | Exceptional $57,742 |
| Immigrants | Israel | 100.0 /100 | #7 | Exceptional $57,384 |
| Immigrants | Hong Kong | 100.0 /100 | #8 | Exceptional $56,709 |
| Immigrants | Ireland | 100.0 /100 | #9 | Exceptional $56,584 |
| Okinawans | 100.0 /100 | #10 | Exceptional $55,817 |
| Eastern Europeans | 100.0 /100 | #11 | Exceptional $55,780 |
| Immigrants | Sweden | 100.0 /100 | #12 | Exceptional $55,582 |
| Immigrants | India | 100.0 /100 | #13 | Exceptional $55,268 |
| Immigrants | Belgium | 100.0 /100 | #14 | Exceptional $55,082 |
| Cypriots | 100.0 /100 | #15 | Exceptional $54,899 |
Demographics Similar to Somalis by Per Capita Income
In terms of per capita income, the demographic groups most similar to Somalis are Tsimshian ($40,344, a difference of 0.060%), Immigrants from Nigeria ($40,339, a difference of 0.070%), British West Indian ($40,330, a difference of 0.090%), Immigrants from Cambodia ($40,434, a difference of 0.16%), and Immigrants from Western Africa ($40,294, a difference of 0.18%).
| Demographics | Rating | Rank | Per Capita Income |
| Senegalese | 4.8 /100 | #231 | Tragic $41,000 |
| Guyanese | 4.5 /100 | #232 | Tragic $40,949 |
| Delaware | 3.8 /100 | #233 | Tragic $40,778 |
| Immigrants | West Indies | 3.7 /100 | #234 | Tragic $40,763 |
| Immigrants | Guyana | 3.6 /100 | #235 | Tragic $40,742 |
| Immigrants | Nonimmigrants | 3.4 /100 | #236 | Tragic $40,669 |
| Immigrants | Cambodia | 2.6 /100 | #237 | Tragic $40,434 |
| Somalis | 2.4 /100 | #238 | Tragic $40,367 |
| Tsimshian | 2.4 /100 | #239 | Tragic $40,344 |
| Immigrants | Nigeria | 2.3 /100 | #240 | Tragic $40,339 |
| British West Indians | 2.3 /100 | #241 | Tragic $40,330 |
| Immigrants | Western Africa | 2.2 /100 | #242 | Tragic $40,294 |
| German Russians | 2.2 /100 | #243 | Tragic $40,266 |
| French American Indians | 2.1 /100 | #244 | Tragic $40,244 |
| Sub-Saharan Africans | 1.9 /100 | #245 | Tragic $40,152 |