Trinidadian and Tobagonian vs Nicaraguan Median Female Earnings
COMPARE
Trinidadian and Tobagonian
Nicaraguan
Median Female Earnings
Median Female Earnings Comparison
Trinidadians and Tobagonians
Nicaraguans
$40,958
MEDIAN FEMALE EARNINGS
93.2/ 100
METRIC RATING
124th/ 347
METRIC RANK
$36,904
MEDIAN FEMALE EARNINGS
0.3/ 100
METRIC RATING
271st/ 347
METRIC RANK
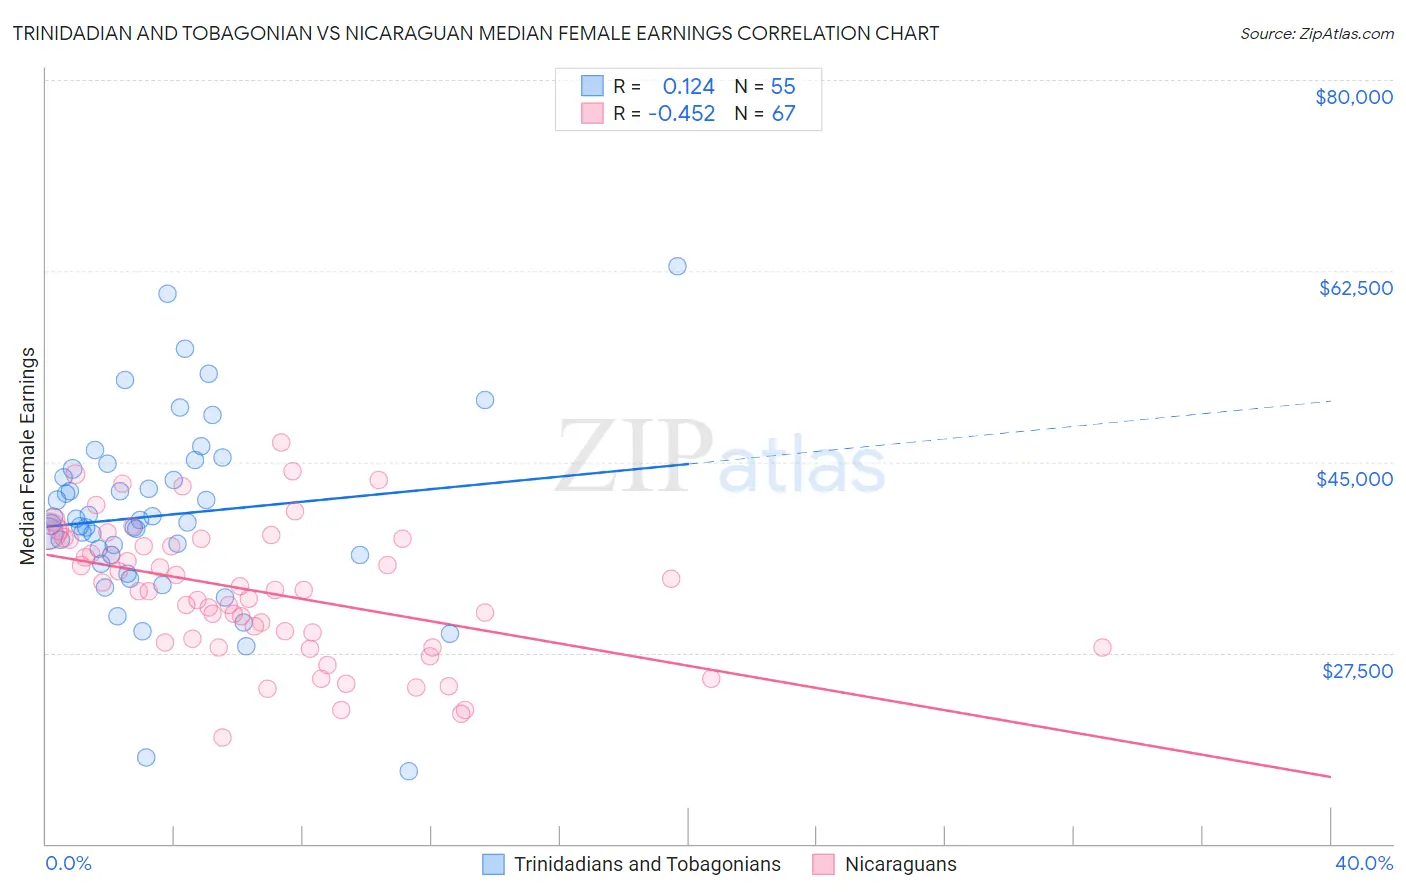
Trinidadian and Tobagonian vs Nicaraguan Median Female Earnings Correlation Chart
The statistical analysis conducted on geographies consisting of 219,833,705 people shows a poor positive correlation between the proportion of Trinidadians and Tobagonians and median female earnings in the United States with a correlation coefficient (R) of 0.124 and weighted average of $40,958. Similarly, the statistical analysis conducted on geographies consisting of 285,562,619 people shows a moderate negative correlation between the proportion of Nicaraguans and median female earnings in the United States with a correlation coefficient (R) of -0.452 and weighted average of $36,904, a difference of 11.0%.
Median Female Earnings Correlation Summary
| Measurement | Trinidadian and Tobagonian | Nicaraguan |
| Minimum | $16,600 | $19,750 |
| Maximum | $62,946 | $46,802 |
| Range | $46,346 | $27,052 |
| Mean | $40,097 | $33,153 |
| Median | $39,462 | $33,262 |
| Interquartile 25% (IQ1) | $36,442 | $28,501 |
| Interquartile 75% (IQ3) | $44,400 | $37,900 |
| Interquartile Range (IQR) | $7,958 | $9,399 |
| Standard Deviation (Sample) | $8,489 | $6,142 |
| Standard Deviation (Population) | $8,412 | $6,096 |
Similar Demographics by Median Female Earnings
Demographics Similar to Trinidadians and Tobagonians by Median Female Earnings
In terms of median female earnings, the demographic groups most similar to Trinidadians and Tobagonians are Guyanese ($40,973, a difference of 0.040%), Immigrants from Jordan ($40,977, a difference of 0.050%), Croatian ($40,993, a difference of 0.090%), Austrian ($40,923, a difference of 0.090%), and Immigrants from Trinidad and Tobago ($40,895, a difference of 0.15%).
| Demographics | Rating | Rank | Median Female Earnings |
| Barbadians | 96.3 /100 | #117 | Exceptional $41,261 |
| Immigrants | Lebanon | 95.6 /100 | #118 | Exceptional $41,183 |
| Immigrants | Philippines | 95.0 /100 | #119 | Exceptional $41,114 |
| Immigrants | Kuwait | 94.4 /100 | #120 | Exceptional $41,055 |
| Croatians | 93.7 /100 | #121 | Exceptional $40,993 |
| Immigrants | Jordan | 93.5 /100 | #122 | Exceptional $40,977 |
| Guyanese | 93.4 /100 | #123 | Exceptional $40,973 |
| Trinidadians and Tobagonians | 93.2 /100 | #124 | Exceptional $40,958 |
| Austrians | 92.7 /100 | #125 | Exceptional $40,923 |
| Immigrants | Trinidad and Tobago | 92.3 /100 | #126 | Exceptional $40,895 |
| Ugandans | 92.2 /100 | #127 | Exceptional $40,889 |
| Carpatho Rusyns | 91.2 /100 | #128 | Exceptional $40,825 |
| Zimbabweans | 90.8 /100 | #129 | Exceptional $40,798 |
| Immigrants | Guyana | 90.3 /100 | #130 | Exceptional $40,773 |
| Chileans | 90.0 /100 | #131 | Exceptional $40,757 |
Demographics Similar to Nicaraguans by Median Female Earnings
In terms of median female earnings, the demographic groups most similar to Nicaraguans are French American Indian ($36,920, a difference of 0.040%), Immigrants from Dominican Republic ($36,857, a difference of 0.13%), Immigrants from Laos ($36,841, a difference of 0.17%), Immigrants from Venezuela ($37,003, a difference of 0.27%), and Cree ($37,018, a difference of 0.31%).
| Demographics | Rating | Rank | Median Female Earnings |
| Salvadorans | 0.4 /100 | #264 | Tragic $37,083 |
| Immigrants | Belize | 0.4 /100 | #265 | Tragic $37,056 |
| Dominicans | 0.4 /100 | #266 | Tragic $37,046 |
| Immigrants | Nonimmigrants | 0.4 /100 | #267 | Tragic $37,024 |
| Cree | 0.4 /100 | #268 | Tragic $37,018 |
| Immigrants | Venezuela | 0.4 /100 | #269 | Tragic $37,003 |
| French American Indians | 0.3 /100 | #270 | Tragic $36,920 |
| Nicaraguans | 0.3 /100 | #271 | Tragic $36,904 |
| Immigrants | Dominican Republic | 0.3 /100 | #272 | Tragic $36,857 |
| Immigrants | Laos | 0.3 /100 | #273 | Tragic $36,841 |
| Immigrants | El Salvador | 0.2 /100 | #274 | Tragic $36,673 |
| Africans | 0.1 /100 | #275 | Tragic $36,530 |
| Central Americans | 0.1 /100 | #276 | Tragic $36,492 |
| Marshallese | 0.1 /100 | #277 | Tragic $36,459 |
| U.S. Virgin Islanders | 0.1 /100 | #278 | Tragic $36,424 |