Trinidadian and Tobagonian vs British West Indian Median Female Earnings
COMPARE
Trinidadian and Tobagonian
British West Indian
Median Female Earnings
Median Female Earnings Comparison
Trinidadians and Tobagonians
British West Indians
$40,958
MEDIAN FEMALE EARNINGS
93.2/ 100
METRIC RATING
124th/ 347
METRIC RANK
$40,299
MEDIAN FEMALE EARNINGS
77.7/ 100
METRIC RATING
153rd/ 347
METRIC RANK
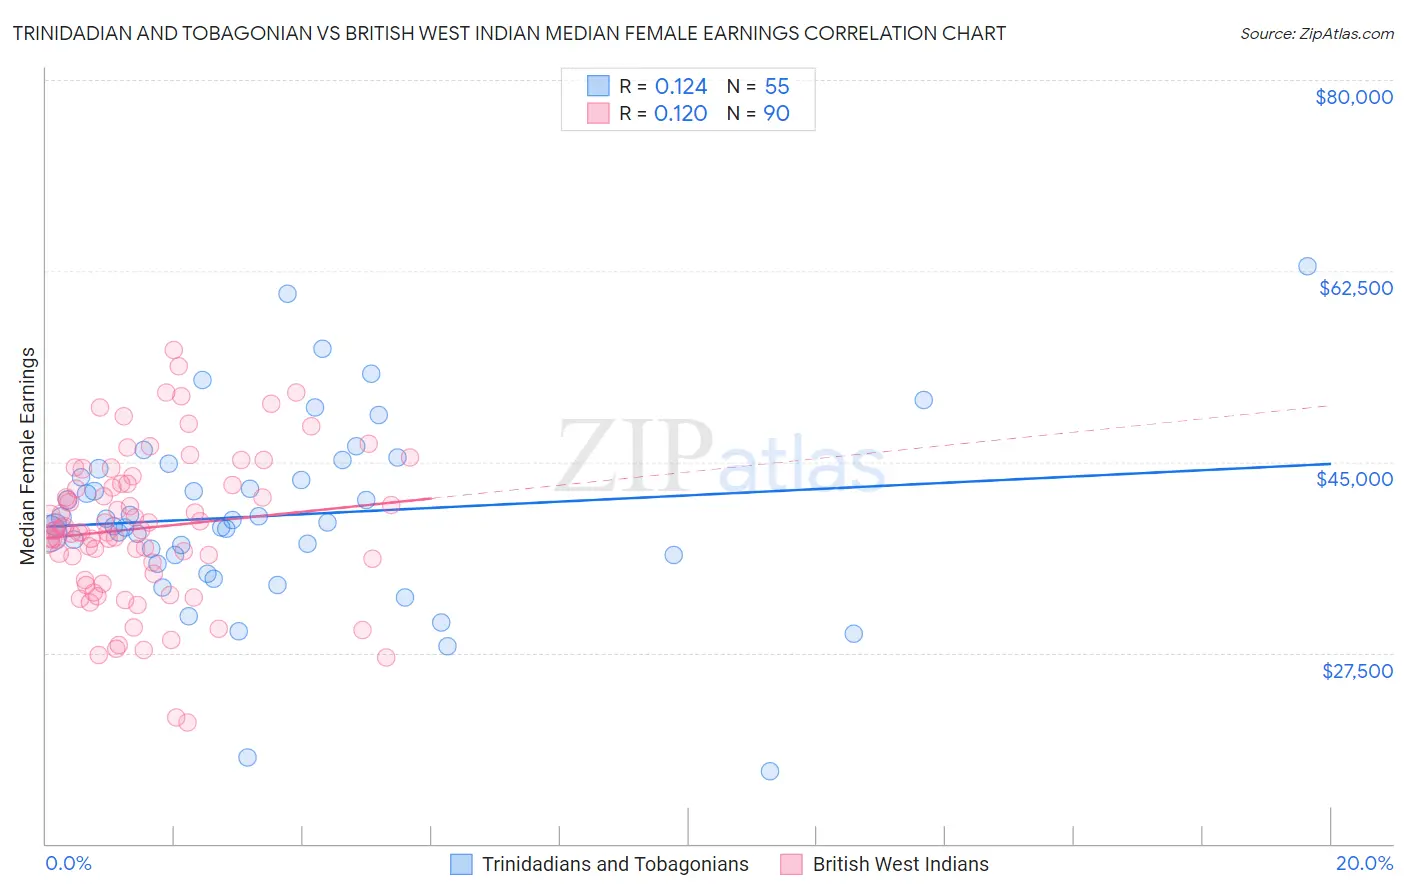
Trinidadian and Tobagonian vs British West Indian Median Female Earnings Correlation Chart
The statistical analysis conducted on geographies consisting of 219,833,705 people shows a poor positive correlation between the proportion of Trinidadians and Tobagonians and median female earnings in the United States with a correlation coefficient (R) of 0.124 and weighted average of $40,958. Similarly, the statistical analysis conducted on geographies consisting of 152,687,488 people shows a poor positive correlation between the proportion of British West Indians and median female earnings in the United States with a correlation coefficient (R) of 0.120 and weighted average of $40,299, a difference of 1.6%.
Median Female Earnings Correlation Summary
| Measurement | Trinidadian and Tobagonian | British West Indian |
| Minimum | $16,600 | $21,143 |
| Maximum | $62,946 | $55,209 |
| Range | $46,346 | $34,066 |
| Mean | $40,097 | $38,959 |
| Median | $39,462 | $38,706 |
| Interquartile 25% (IQ1) | $36,442 | $34,766 |
| Interquartile 75% (IQ3) | $44,400 | $42,968 |
| Interquartile Range (IQR) | $7,958 | $8,202 |
| Standard Deviation (Sample) | $8,489 | $6,842 |
| Standard Deviation (Population) | $8,412 | $6,804 |
Similar Demographics by Median Female Earnings
Demographics Similar to Trinidadians and Tobagonians by Median Female Earnings
In terms of median female earnings, the demographic groups most similar to Trinidadians and Tobagonians are Guyanese ($40,973, a difference of 0.040%), Immigrants from Jordan ($40,977, a difference of 0.050%), Croatian ($40,993, a difference of 0.090%), Austrian ($40,923, a difference of 0.090%), and Immigrants from Trinidad and Tobago ($40,895, a difference of 0.15%).
| Demographics | Rating | Rank | Median Female Earnings |
| Barbadians | 96.3 /100 | #117 | Exceptional $41,261 |
| Immigrants | Lebanon | 95.6 /100 | #118 | Exceptional $41,183 |
| Immigrants | Philippines | 95.0 /100 | #119 | Exceptional $41,114 |
| Immigrants | Kuwait | 94.4 /100 | #120 | Exceptional $41,055 |
| Croatians | 93.7 /100 | #121 | Exceptional $40,993 |
| Immigrants | Jordan | 93.5 /100 | #122 | Exceptional $40,977 |
| Guyanese | 93.4 /100 | #123 | Exceptional $40,973 |
| Trinidadians and Tobagonians | 93.2 /100 | #124 | Exceptional $40,958 |
| Austrians | 92.7 /100 | #125 | Exceptional $40,923 |
| Immigrants | Trinidad and Tobago | 92.3 /100 | #126 | Exceptional $40,895 |
| Ugandans | 92.2 /100 | #127 | Exceptional $40,889 |
| Carpatho Rusyns | 91.2 /100 | #128 | Exceptional $40,825 |
| Zimbabweans | 90.8 /100 | #129 | Exceptional $40,798 |
| Immigrants | Guyana | 90.3 /100 | #130 | Exceptional $40,773 |
| Chileans | 90.0 /100 | #131 | Exceptional $40,757 |
Demographics Similar to British West Indians by Median Female Earnings
In terms of median female earnings, the demographic groups most similar to British West Indians are Immigrants from Oceania ($40,297, a difference of 0.010%), West Indian ($40,317, a difference of 0.040%), Immigrants from Armenia ($40,340, a difference of 0.10%), Immigrants from Africa ($40,257, a difference of 0.10%), and Immigrants from Chile ($40,353, a difference of 0.13%).
| Demographics | Rating | Rank | Median Female Earnings |
| Ghanaians | 82.1 /100 | #146 | Excellent $40,429 |
| Vietnamese | 80.4 /100 | #147 | Excellent $40,377 |
| Poles | 80.2 /100 | #148 | Excellent $40,371 |
| Immigrants | Cameroon | 79.7 /100 | #149 | Good $40,354 |
| Immigrants | Chile | 79.6 /100 | #150 | Good $40,353 |
| Immigrants | Armenia | 79.2 /100 | #151 | Good $40,340 |
| West Indians | 78.4 /100 | #152 | Good $40,317 |
| British West Indians | 77.7 /100 | #153 | Good $40,299 |
| Immigrants | Oceania | 77.6 /100 | #154 | Good $40,297 |
| Immigrants | Africa | 76.2 /100 | #155 | Good $40,257 |
| Peruvians | 75.3 /100 | #156 | Good $40,234 |
| Portuguese | 73.0 /100 | #157 | Good $40,177 |
| Immigrants | Senegal | 72.2 /100 | #158 | Good $40,157 |
| Immigrants | Vietnam | 72.0 /100 | #159 | Good $40,153 |
| Inupiat | 68.9 /100 | #160 | Good $40,080 |