Immigrants from Portugal vs Nicaraguan Median Female Earnings
COMPARE
Immigrants from Portugal
Nicaraguan
Median Female Earnings
Median Female Earnings Comparison
Immigrants from Portugal
Nicaraguans
$39,788
MEDIAN FEMALE EARNINGS
54.7/ 100
METRIC RATING
171st/ 347
METRIC RANK
$36,904
MEDIAN FEMALE EARNINGS
0.3/ 100
METRIC RATING
271st/ 347
METRIC RANK
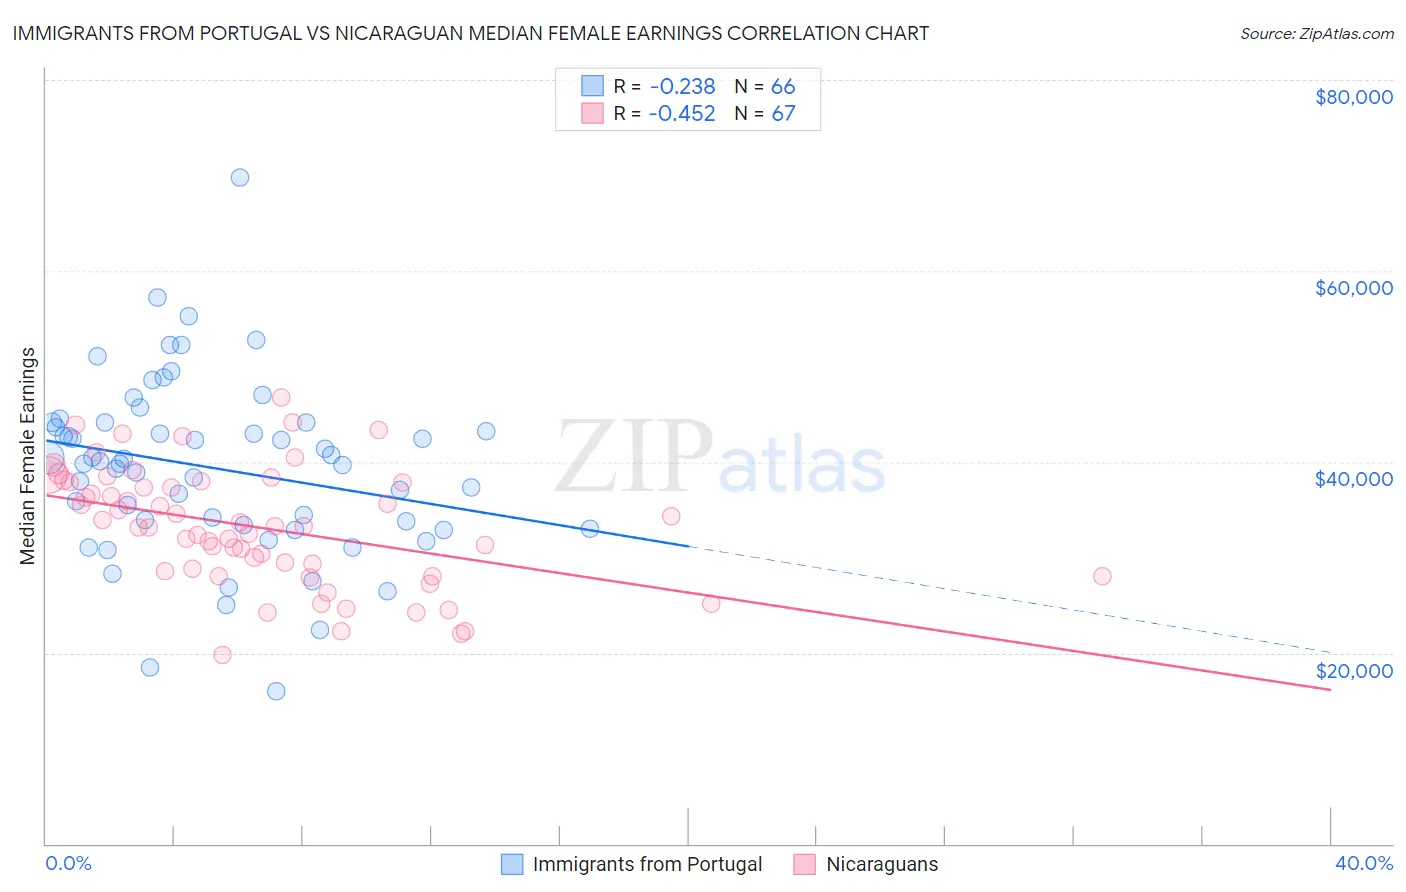
Immigrants from Portugal vs Nicaraguan Median Female Earnings Correlation Chart
The statistical analysis conducted on geographies consisting of 174,753,972 people shows a weak negative correlation between the proportion of Immigrants from Portugal and median female earnings in the United States with a correlation coefficient (R) of -0.238 and weighted average of $39,788. Similarly, the statistical analysis conducted on geographies consisting of 285,562,619 people shows a moderate negative correlation between the proportion of Nicaraguans and median female earnings in the United States with a correlation coefficient (R) of -0.452 and weighted average of $36,904, a difference of 7.8%.
Median Female Earnings Correlation Summary
| Measurement | Immigrants from Portugal | Nicaraguan |
| Minimum | $15,996 | $19,750 |
| Maximum | $69,732 | $46,802 |
| Range | $53,736 | $27,052 |
| Mean | $39,346 | $33,153 |
| Median | $39,980 | $33,262 |
| Interquartile 25% (IQ1) | $33,451 | $28,501 |
| Interquartile 75% (IQ3) | $44,115 | $37,900 |
| Interquartile Range (IQR) | $10,664 | $9,399 |
| Standard Deviation (Sample) | $9,199 | $6,142 |
| Standard Deviation (Population) | $9,130 | $6,096 |
Similar Demographics by Median Female Earnings
Demographics Similar to Immigrants from Portugal by Median Female Earnings
In terms of median female earnings, the demographic groups most similar to Immigrants from Portugal are British ($39,772, a difference of 0.040%), Slovene ($39,817, a difference of 0.070%), Canadian ($39,724, a difference of 0.16%), Kenyan ($39,860, a difference of 0.18%), and Immigrants from Peru ($39,871, a difference of 0.21%).
| Demographics | Rating | Rank | Median Female Earnings |
| Immigrants | Saudi Arabia | 62.9 /100 | #164 | Good $39,952 |
| Immigrants | Bangladesh | 60.8 /100 | #165 | Good $39,910 |
| Immigrants | Ghana | 60.0 /100 | #166 | Good $39,894 |
| Luxembourgers | 59.9 /100 | #167 | Average $39,891 |
| Immigrants | Peru | 58.9 /100 | #168 | Average $39,871 |
| Kenyans | 58.4 /100 | #169 | Average $39,860 |
| Slovenes | 56.2 /100 | #170 | Average $39,817 |
| Immigrants | Portugal | 54.7 /100 | #171 | Average $39,788 |
| British | 53.8 /100 | #172 | Average $39,772 |
| Canadians | 51.4 /100 | #173 | Average $39,724 |
| South Americans | 50.0 /100 | #174 | Average $39,698 |
| Immigrants | South America | 47.2 /100 | #175 | Average $39,643 |
| Nigerians | 47.0 /100 | #176 | Average $39,641 |
| Costa Ricans | 46.1 /100 | #177 | Average $39,622 |
| Slavs | 45.6 /100 | #178 | Average $39,613 |
Demographics Similar to Nicaraguans by Median Female Earnings
In terms of median female earnings, the demographic groups most similar to Nicaraguans are French American Indian ($36,920, a difference of 0.040%), Immigrants from Dominican Republic ($36,857, a difference of 0.13%), Immigrants from Laos ($36,841, a difference of 0.17%), Immigrants from Venezuela ($37,003, a difference of 0.27%), and Cree ($37,018, a difference of 0.31%).
| Demographics | Rating | Rank | Median Female Earnings |
| Salvadorans | 0.4 /100 | #264 | Tragic $37,083 |
| Immigrants | Belize | 0.4 /100 | #265 | Tragic $37,056 |
| Dominicans | 0.4 /100 | #266 | Tragic $37,046 |
| Immigrants | Nonimmigrants | 0.4 /100 | #267 | Tragic $37,024 |
| Cree | 0.4 /100 | #268 | Tragic $37,018 |
| Immigrants | Venezuela | 0.4 /100 | #269 | Tragic $37,003 |
| French American Indians | 0.3 /100 | #270 | Tragic $36,920 |
| Nicaraguans | 0.3 /100 | #271 | Tragic $36,904 |
| Immigrants | Dominican Republic | 0.3 /100 | #272 | Tragic $36,857 |
| Immigrants | Laos | 0.3 /100 | #273 | Tragic $36,841 |
| Immigrants | El Salvador | 0.2 /100 | #274 | Tragic $36,673 |
| Africans | 0.1 /100 | #275 | Tragic $36,530 |
| Central Americans | 0.1 /100 | #276 | Tragic $36,492 |
| Marshallese | 0.1 /100 | #277 | Tragic $36,459 |
| U.S. Virgin Islanders | 0.1 /100 | #278 | Tragic $36,424 |