Trinidadian and Tobagonian vs Austrian Median Female Earnings
COMPARE
Trinidadian and Tobagonian
Austrian
Median Female Earnings
Median Female Earnings Comparison
Trinidadians and Tobagonians
Austrians
$40,958
MEDIAN FEMALE EARNINGS
93.2/ 100
METRIC RATING
124th/ 347
METRIC RANK
$40,923
MEDIAN FEMALE EARNINGS
92.7/ 100
METRIC RATING
125th/ 347
METRIC RANK
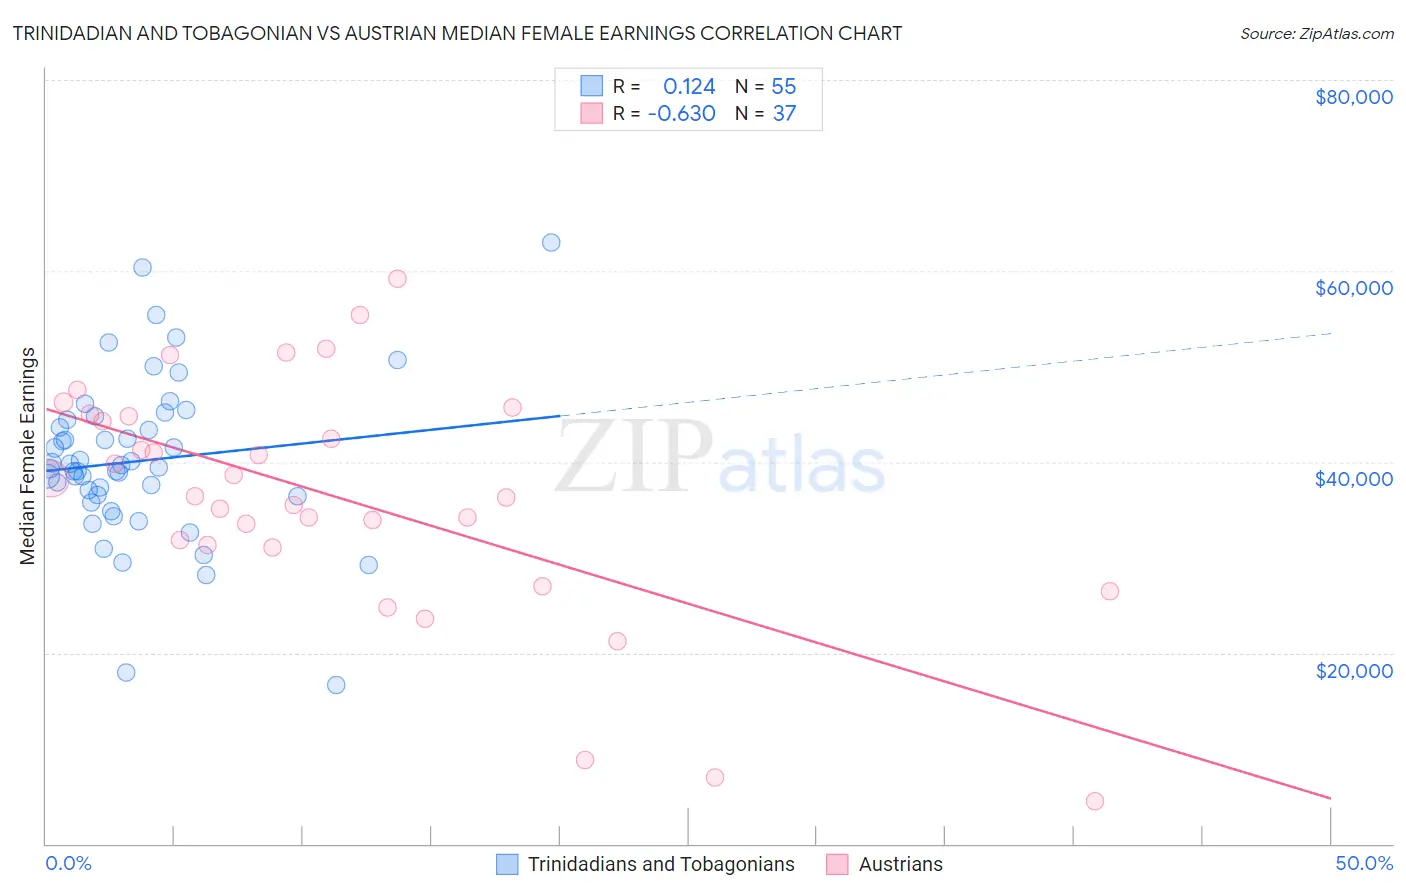
Trinidadian and Tobagonian vs Austrian Median Female Earnings Correlation Chart
The statistical analysis conducted on geographies consisting of 219,833,705 people shows a poor positive correlation between the proportion of Trinidadians and Tobagonians and median female earnings in the United States with a correlation coefficient (R) of 0.124 and weighted average of $40,958. Similarly, the statistical analysis conducted on geographies consisting of 451,723,547 people shows a significant negative correlation between the proportion of Austrians and median female earnings in the United States with a correlation coefficient (R) of -0.630 and weighted average of $40,923, a difference of 0.090%.
Median Female Earnings Correlation Summary
| Measurement | Trinidadian and Tobagonian | Austrian |
| Minimum | $16,600 | $4,400 |
| Maximum | $62,946 | $59,167 |
| Range | $46,346 | $54,767 |
| Mean | $40,097 | $36,245 |
| Median | $39,462 | $36,406 |
| Interquartile 25% (IQ1) | $36,442 | $31,217 |
| Interquartile 75% (IQ3) | $44,400 | $44,864 |
| Interquartile Range (IQR) | $7,958 | $13,647 |
| Standard Deviation (Sample) | $8,489 | $12,547 |
| Standard Deviation (Population) | $8,412 | $12,376 |
Demographics Similar to Trinidadians and Tobagonians and Austrians by Median Female Earnings
In terms of median female earnings, the demographic groups most similar to Trinidadians and Tobagonians are Guyanese ($40,973, a difference of 0.040%), Immigrants from Jordan ($40,977, a difference of 0.050%), Croatian ($40,993, a difference of 0.090%), Immigrants from Trinidad and Tobago ($40,895, a difference of 0.15%), and Ugandan ($40,889, a difference of 0.17%). Similarly, the demographic groups most similar to Austrians are Immigrants from Trinidad and Tobago ($40,895, a difference of 0.070%), Ugandan ($40,889, a difference of 0.080%), Guyanese ($40,973, a difference of 0.12%), Immigrants from Jordan ($40,977, a difference of 0.13%), and Croatian ($40,993, a difference of 0.17%).
| Demographics | Rating | Rank | Median Female Earnings |
| Immigrants | England | 96.4 /100 | #114 | Exceptional $41,277 |
| Koreans | 96.4 /100 | #115 | Exceptional $41,276 |
| Immigrants | Brazil | 96.4 /100 | #116 | Exceptional $41,273 |
| Barbadians | 96.3 /100 | #117 | Exceptional $41,261 |
| Immigrants | Lebanon | 95.6 /100 | #118 | Exceptional $41,183 |
| Immigrants | Philippines | 95.0 /100 | #119 | Exceptional $41,114 |
| Immigrants | Kuwait | 94.4 /100 | #120 | Exceptional $41,055 |
| Croatians | 93.7 /100 | #121 | Exceptional $40,993 |
| Immigrants | Jordan | 93.5 /100 | #122 | Exceptional $40,977 |
| Guyanese | 93.4 /100 | #123 | Exceptional $40,973 |
| Trinidadians and Tobagonians | 93.2 /100 | #124 | Exceptional $40,958 |
| Austrians | 92.7 /100 | #125 | Exceptional $40,923 |
| Immigrants | Trinidad and Tobago | 92.3 /100 | #126 | Exceptional $40,895 |
| Ugandans | 92.2 /100 | #127 | Exceptional $40,889 |
| Carpatho Rusyns | 91.2 /100 | #128 | Exceptional $40,825 |
| Zimbabweans | 90.8 /100 | #129 | Exceptional $40,798 |
| Immigrants | Guyana | 90.3 /100 | #130 | Exceptional $40,773 |
| Chileans | 90.0 /100 | #131 | Exceptional $40,757 |
| Immigrants | Uganda | 89.7 /100 | #132 | Excellent $40,739 |
| Syrians | 89.5 /100 | #133 | Excellent $40,727 |
| Arabs | 89.3 /100 | #134 | Excellent $40,718 |