Pueblo vs Nicaraguan Median Female Earnings
COMPARE
Pueblo
Nicaraguan
Median Female Earnings
Median Female Earnings Comparison
Pueblo
Nicaraguans
$32,564
MEDIAN FEMALE EARNINGS
0.0/ 100
METRIC RATING
343rd/ 347
METRIC RANK
$36,904
MEDIAN FEMALE EARNINGS
0.3/ 100
METRIC RATING
271st/ 347
METRIC RANK
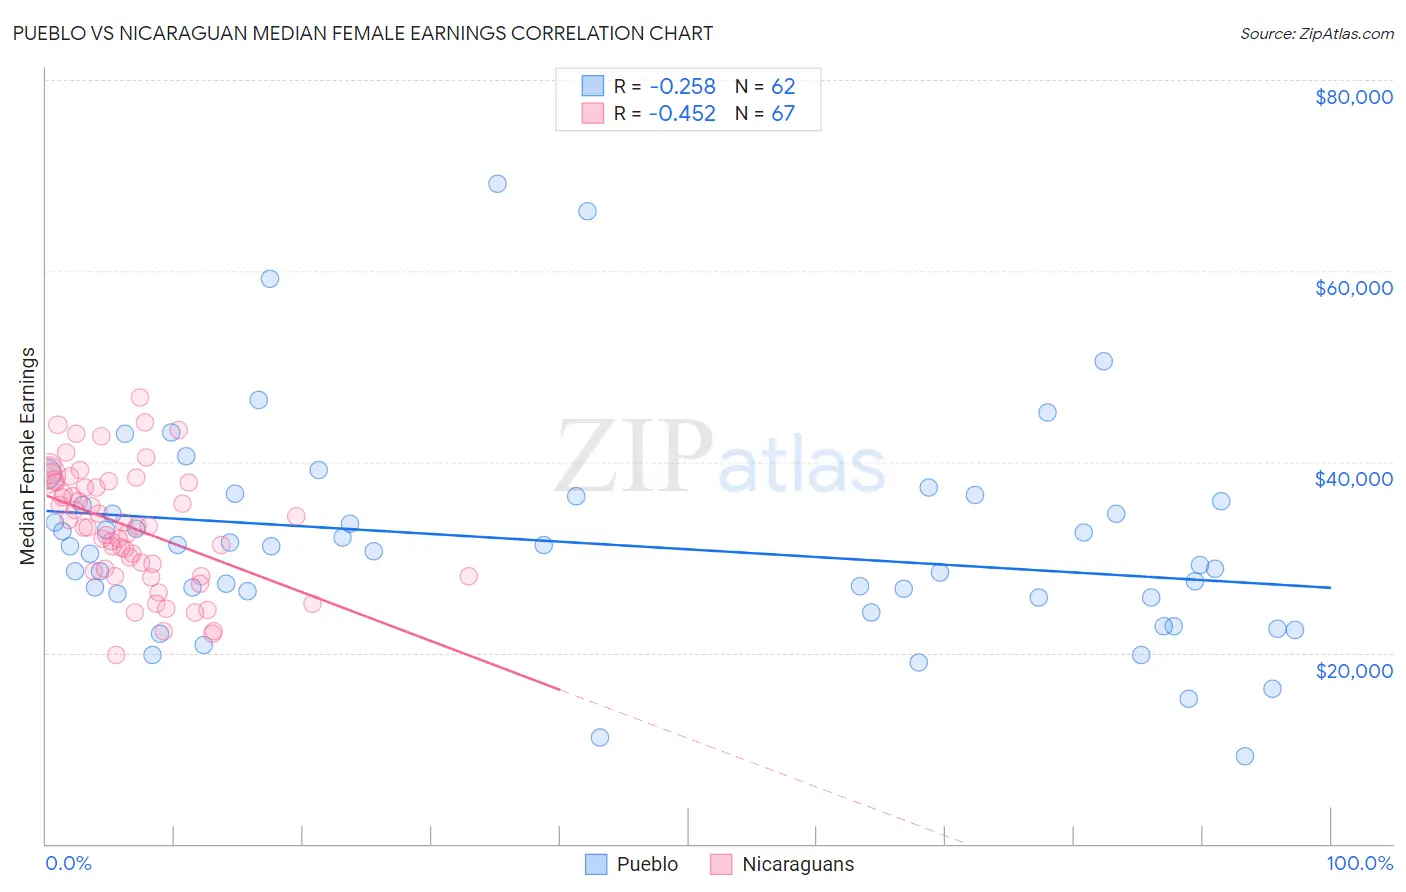
Pueblo vs Nicaraguan Median Female Earnings Correlation Chart
The statistical analysis conducted on geographies consisting of 120,036,612 people shows a weak negative correlation between the proportion of Pueblo and median female earnings in the United States with a correlation coefficient (R) of -0.258 and weighted average of $32,564. Similarly, the statistical analysis conducted on geographies consisting of 285,562,619 people shows a moderate negative correlation between the proportion of Nicaraguans and median female earnings in the United States with a correlation coefficient (R) of -0.452 and weighted average of $36,904, a difference of 13.3%.
Median Female Earnings Correlation Summary
| Measurement | Pueblo | Nicaraguan |
| Minimum | $9,219 | $19,750 |
| Maximum | $69,074 | $46,802 |
| Range | $59,855 | $27,052 |
| Mean | $31,512 | $33,153 |
| Median | $30,863 | $33,262 |
| Interquartile 25% (IQ1) | $25,792 | $28,501 |
| Interquartile 75% (IQ3) | $35,833 | $37,900 |
| Interquartile Range (IQR) | $10,041 | $9,399 |
| Standard Deviation (Sample) | $11,084 | $6,142 |
| Standard Deviation (Population) | $10,994 | $6,096 |
Similar Demographics by Median Female Earnings
Demographics Similar to Pueblo by Median Female Earnings
In terms of median female earnings, the demographic groups most similar to Pueblo are Lumbee ($32,500, a difference of 0.20%), Yup'ik ($32,730, a difference of 0.51%), Navajo ($33,046, a difference of 1.5%), Tohono O'odham ($33,205, a difference of 2.0%), and Immigrants from Mexico ($33,236, a difference of 2.1%).
| Demographics | Rating | Rank | Median Female Earnings |
| Mexicans | 0.0 /100 | #333 | Tragic $33,664 |
| Spanish American Indians | 0.0 /100 | #334 | Tragic $33,625 |
| Creek | 0.0 /100 | #335 | Tragic $33,437 |
| Ottawa | 0.0 /100 | #336 | Tragic $33,378 |
| Yakama | 0.0 /100 | #337 | Tragic $33,354 |
| Immigrants | Cuba | 0.0 /100 | #338 | Tragic $33,291 |
| Immigrants | Mexico | 0.0 /100 | #339 | Tragic $33,236 |
| Tohono O'odham | 0.0 /100 | #340 | Tragic $33,205 |
| Navajo | 0.0 /100 | #341 | Tragic $33,046 |
| Yup'ik | 0.0 /100 | #342 | Tragic $32,730 |
| Pueblo | 0.0 /100 | #343 | Tragic $32,564 |
| Lumbee | 0.0 /100 | #344 | Tragic $32,500 |
| Puerto Ricans | 0.0 /100 | #345 | Tragic $31,560 |
| Arapaho | 0.0 /100 | #346 | Tragic $31,489 |
| Houma | 0.0 /100 | #347 | Tragic $30,343 |
Demographics Similar to Nicaraguans by Median Female Earnings
In terms of median female earnings, the demographic groups most similar to Nicaraguans are French American Indian ($36,920, a difference of 0.040%), Immigrants from Dominican Republic ($36,857, a difference of 0.13%), Immigrants from Laos ($36,841, a difference of 0.17%), Immigrants from Venezuela ($37,003, a difference of 0.27%), and Cree ($37,018, a difference of 0.31%).
| Demographics | Rating | Rank | Median Female Earnings |
| Salvadorans | 0.4 /100 | #264 | Tragic $37,083 |
| Immigrants | Belize | 0.4 /100 | #265 | Tragic $37,056 |
| Dominicans | 0.4 /100 | #266 | Tragic $37,046 |
| Immigrants | Nonimmigrants | 0.4 /100 | #267 | Tragic $37,024 |
| Cree | 0.4 /100 | #268 | Tragic $37,018 |
| Immigrants | Venezuela | 0.4 /100 | #269 | Tragic $37,003 |
| French American Indians | 0.3 /100 | #270 | Tragic $36,920 |
| Nicaraguans | 0.3 /100 | #271 | Tragic $36,904 |
| Immigrants | Dominican Republic | 0.3 /100 | #272 | Tragic $36,857 |
| Immigrants | Laos | 0.3 /100 | #273 | Tragic $36,841 |
| Immigrants | El Salvador | 0.2 /100 | #274 | Tragic $36,673 |
| Africans | 0.1 /100 | #275 | Tragic $36,530 |
| Central Americans | 0.1 /100 | #276 | Tragic $36,492 |
| Marshallese | 0.1 /100 | #277 | Tragic $36,459 |
| U.S. Virgin Islanders | 0.1 /100 | #278 | Tragic $36,424 |