Immigrants from Norway vs Nicaraguan Median Female Earnings
COMPARE
Immigrants from Norway
Nicaraguan
Median Female Earnings
Median Female Earnings Comparison
Immigrants from Norway
Nicaraguans
$42,837
MEDIAN FEMALE EARNINGS
99.9/ 100
METRIC RATING
66th/ 347
METRIC RANK
$36,904
MEDIAN FEMALE EARNINGS
0.3/ 100
METRIC RATING
271st/ 347
METRIC RANK
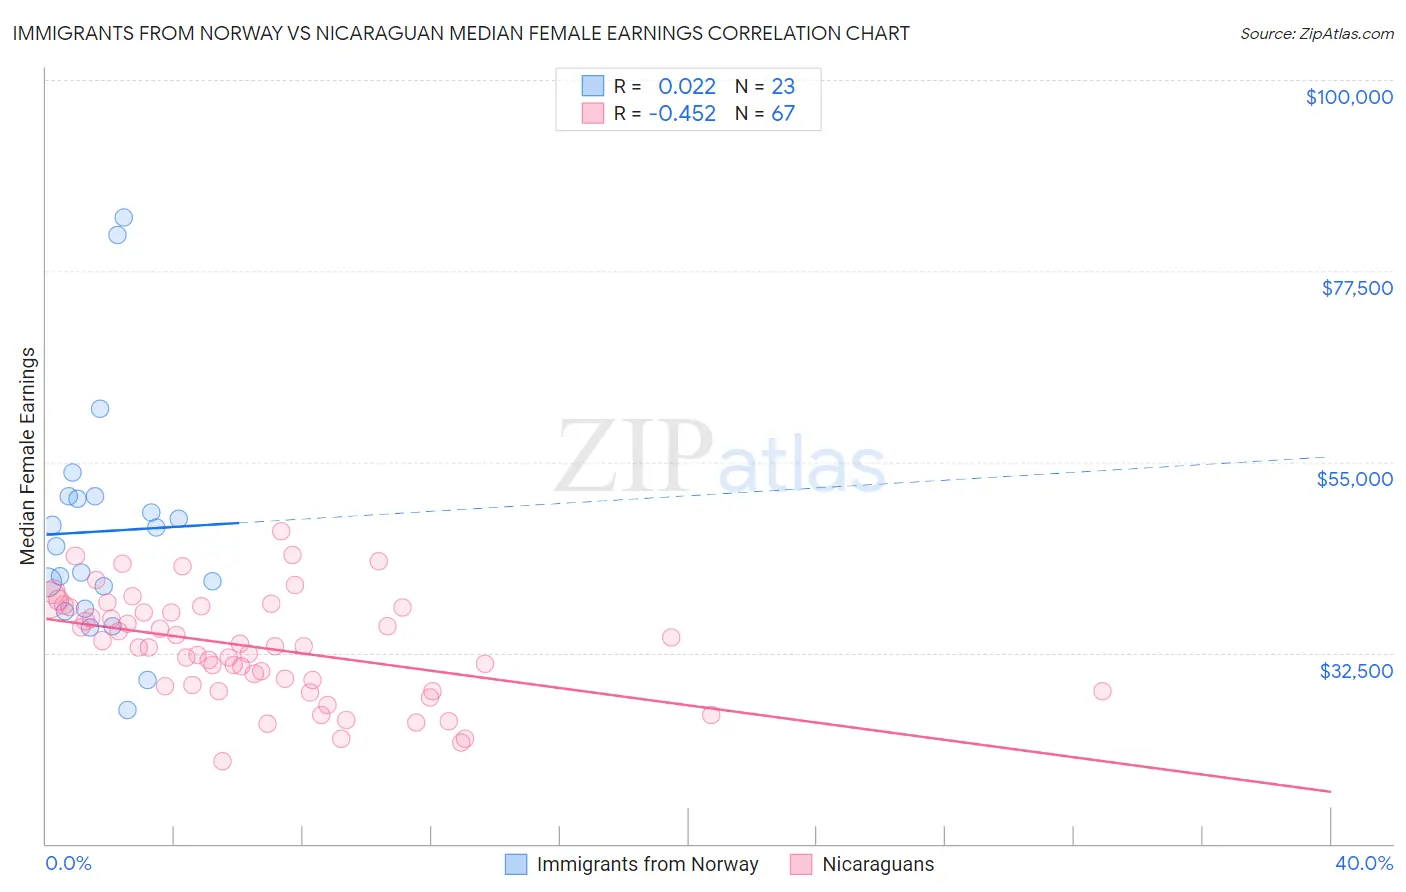
Immigrants from Norway vs Nicaraguan Median Female Earnings Correlation Chart
The statistical analysis conducted on geographies consisting of 116,697,364 people shows no correlation between the proportion of Immigrants from Norway and median female earnings in the United States with a correlation coefficient (R) of 0.022 and weighted average of $42,837. Similarly, the statistical analysis conducted on geographies consisting of 285,562,619 people shows a moderate negative correlation between the proportion of Nicaraguans and median female earnings in the United States with a correlation coefficient (R) of -0.452 and weighted average of $36,904, a difference of 16.1%.
Median Female Earnings Correlation Summary
| Measurement | Immigrants from Norway | Nicaraguan |
| Minimum | $25,783 | $19,750 |
| Maximum | $83,727 | $46,802 |
| Range | $57,944 | $27,052 |
| Mean | $46,834 | $33,153 |
| Median | $44,998 | $33,262 |
| Interquartile 25% (IQ1) | $37,628 | $28,501 |
| Interquartile 75% (IQ3) | $50,939 | $37,900 |
| Interquartile Range (IQR) | $13,311 | $9,399 |
| Standard Deviation (Sample) | $13,874 | $6,142 |
| Standard Deviation (Population) | $13,569 | $6,096 |
Similar Demographics by Median Female Earnings
Demographics Similar to Immigrants from Norway by Median Female Earnings
In terms of median female earnings, the demographic groups most similar to Immigrants from Norway are Immigrants from Egypt ($42,837, a difference of 0.0%), Immigrants from Austria ($42,824, a difference of 0.030%), Immigrants from Spain ($42,815, a difference of 0.050%), Sierra Leonean ($42,868, a difference of 0.070%), and Immigrants from Ethiopia ($42,744, a difference of 0.22%).
| Demographics | Rating | Rank | Median Female Earnings |
| Estonians | 99.9 /100 | #59 | Exceptional $43,106 |
| Immigrants | Latvia | 99.9 /100 | #60 | Exceptional $43,099 |
| Immigrants | Bulgaria | 99.9 /100 | #61 | Exceptional $43,085 |
| Afghans | 99.9 /100 | #62 | Exceptional $43,077 |
| Immigrants | Ukraine | 99.9 /100 | #63 | Exceptional $43,069 |
| Immigrants | Pakistan | 99.9 /100 | #64 | Exceptional $43,052 |
| Sierra Leoneans | 99.9 /100 | #65 | Exceptional $42,868 |
| Immigrants | Norway | 99.9 /100 | #66 | Exceptional $42,837 |
| Immigrants | Egypt | 99.9 /100 | #67 | Exceptional $42,837 |
| Immigrants | Austria | 99.8 /100 | #68 | Exceptional $42,824 |
| Immigrants | Spain | 99.8 /100 | #69 | Exceptional $42,815 |
| Immigrants | Ethiopia | 99.8 /100 | #70 | Exceptional $42,744 |
| Immigrants | Romania | 99.8 /100 | #71 | Exceptional $42,718 |
| Albanians | 99.8 /100 | #72 | Exceptional $42,584 |
| Mongolians | 99.7 /100 | #73 | Exceptional $42,542 |
Demographics Similar to Nicaraguans by Median Female Earnings
In terms of median female earnings, the demographic groups most similar to Nicaraguans are French American Indian ($36,920, a difference of 0.040%), Immigrants from Dominican Republic ($36,857, a difference of 0.13%), Immigrants from Laos ($36,841, a difference of 0.17%), Immigrants from Venezuela ($37,003, a difference of 0.27%), and Cree ($37,018, a difference of 0.31%).
| Demographics | Rating | Rank | Median Female Earnings |
| Salvadorans | 0.4 /100 | #264 | Tragic $37,083 |
| Immigrants | Belize | 0.4 /100 | #265 | Tragic $37,056 |
| Dominicans | 0.4 /100 | #266 | Tragic $37,046 |
| Immigrants | Nonimmigrants | 0.4 /100 | #267 | Tragic $37,024 |
| Cree | 0.4 /100 | #268 | Tragic $37,018 |
| Immigrants | Venezuela | 0.4 /100 | #269 | Tragic $37,003 |
| French American Indians | 0.3 /100 | #270 | Tragic $36,920 |
| Nicaraguans | 0.3 /100 | #271 | Tragic $36,904 |
| Immigrants | Dominican Republic | 0.3 /100 | #272 | Tragic $36,857 |
| Immigrants | Laos | 0.3 /100 | #273 | Tragic $36,841 |
| Immigrants | El Salvador | 0.2 /100 | #274 | Tragic $36,673 |
| Africans | 0.1 /100 | #275 | Tragic $36,530 |
| Central Americans | 0.1 /100 | #276 | Tragic $36,492 |
| Marshallese | 0.1 /100 | #277 | Tragic $36,459 |
| U.S. Virgin Islanders | 0.1 /100 | #278 | Tragic $36,424 |