Trinidadian and Tobagonian vs Guamanian/Chamorro Median Female Earnings
COMPARE
Trinidadian and Tobagonian
Guamanian/Chamorro
Median Female Earnings
Median Female Earnings Comparison
Trinidadians and Tobagonians
Guamanians/Chamorros
$40,958
MEDIAN FEMALE EARNINGS
93.2/ 100
METRIC RATING
124th/ 347
METRIC RANK
$38,717
MEDIAN FEMALE EARNINGS
11.5/ 100
METRIC RATING
212th/ 347
METRIC RANK
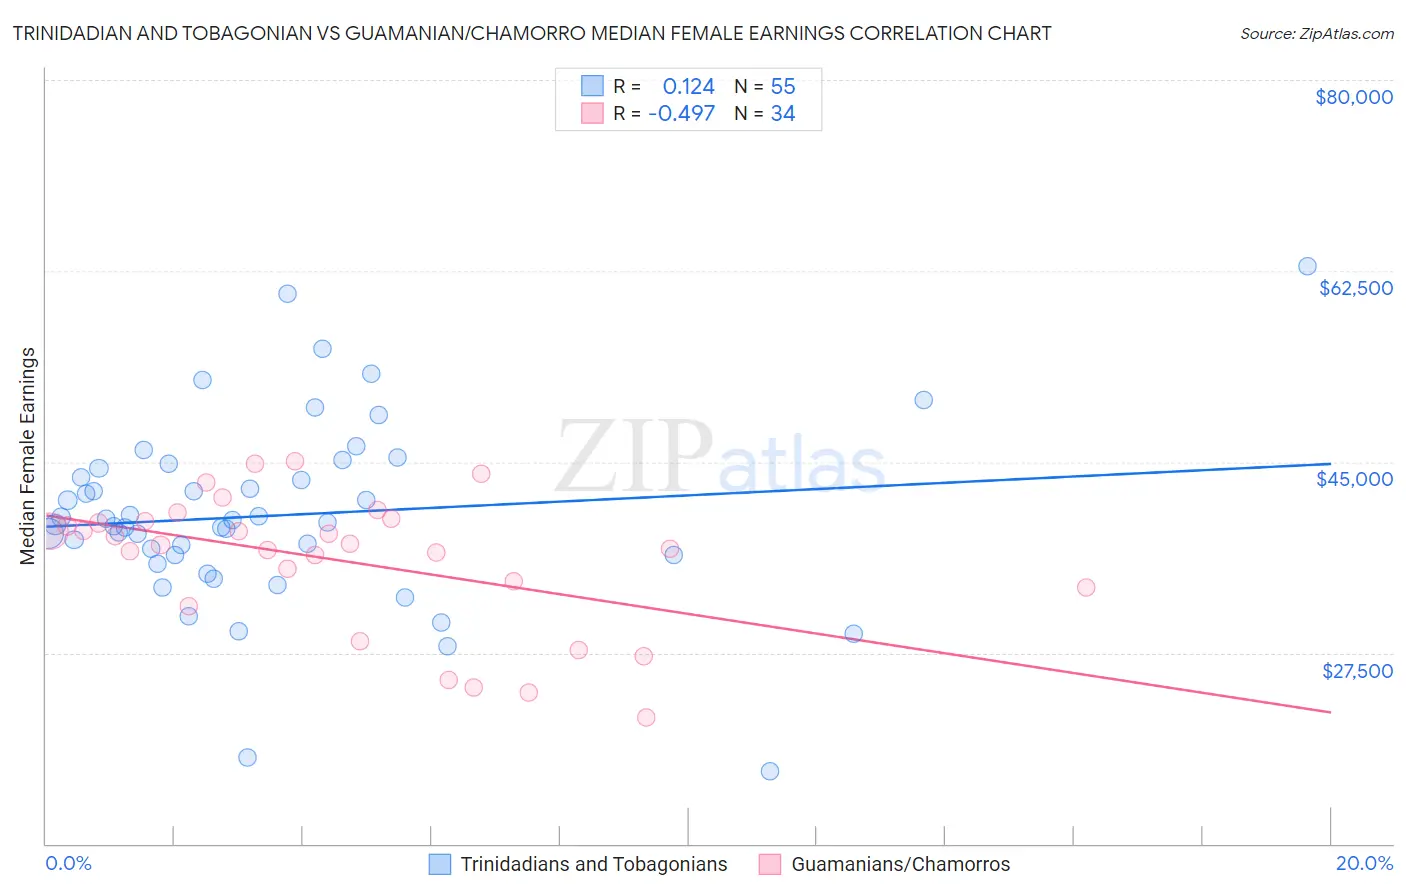
Trinidadian and Tobagonian vs Guamanian/Chamorro Median Female Earnings Correlation Chart
The statistical analysis conducted on geographies consisting of 219,833,705 people shows a poor positive correlation between the proportion of Trinidadians and Tobagonians and median female earnings in the United States with a correlation coefficient (R) of 0.124 and weighted average of $40,958. Similarly, the statistical analysis conducted on geographies consisting of 221,909,570 people shows a moderate negative correlation between the proportion of Guamanians/Chamorros and median female earnings in the United States with a correlation coefficient (R) of -0.497 and weighted average of $38,717, a difference of 5.8%.
Median Female Earnings Correlation Summary
| Measurement | Trinidadian and Tobagonian | Guamanian/Chamorro |
| Minimum | $16,600 | $21,607 |
| Maximum | $62,946 | $45,111 |
| Range | $46,346 | $23,504 |
| Mean | $40,097 | $35,932 |
| Median | $39,462 | $37,420 |
| Interquartile 25% (IQ1) | $36,442 | $33,542 |
| Interquartile 75% (IQ3) | $44,400 | $39,523 |
| Interquartile Range (IQR) | $7,958 | $5,981 |
| Standard Deviation (Sample) | $8,489 | $6,215 |
| Standard Deviation (Population) | $8,412 | $6,122 |
Similar Demographics by Median Female Earnings
Demographics Similar to Trinidadians and Tobagonians by Median Female Earnings
In terms of median female earnings, the demographic groups most similar to Trinidadians and Tobagonians are Guyanese ($40,973, a difference of 0.040%), Immigrants from Jordan ($40,977, a difference of 0.050%), Croatian ($40,993, a difference of 0.090%), Austrian ($40,923, a difference of 0.090%), and Immigrants from Trinidad and Tobago ($40,895, a difference of 0.15%).
| Demographics | Rating | Rank | Median Female Earnings |
| Barbadians | 96.3 /100 | #117 | Exceptional $41,261 |
| Immigrants | Lebanon | 95.6 /100 | #118 | Exceptional $41,183 |
| Immigrants | Philippines | 95.0 /100 | #119 | Exceptional $41,114 |
| Immigrants | Kuwait | 94.4 /100 | #120 | Exceptional $41,055 |
| Croatians | 93.7 /100 | #121 | Exceptional $40,993 |
| Immigrants | Jordan | 93.5 /100 | #122 | Exceptional $40,977 |
| Guyanese | 93.4 /100 | #123 | Exceptional $40,973 |
| Trinidadians and Tobagonians | 93.2 /100 | #124 | Exceptional $40,958 |
| Austrians | 92.7 /100 | #125 | Exceptional $40,923 |
| Immigrants | Trinidad and Tobago | 92.3 /100 | #126 | Exceptional $40,895 |
| Ugandans | 92.2 /100 | #127 | Exceptional $40,889 |
| Carpatho Rusyns | 91.2 /100 | #128 | Exceptional $40,825 |
| Zimbabweans | 90.8 /100 | #129 | Exceptional $40,798 |
| Immigrants | Guyana | 90.3 /100 | #130 | Exceptional $40,773 |
| Chileans | 90.0 /100 | #131 | Exceptional $40,757 |
Demographics Similar to Guamanians/Chamorros by Median Female Earnings
In terms of median female earnings, the demographic groups most similar to Guamanians/Chamorros are Aleut ($38,719, a difference of 0.010%), Czechoslovakian ($38,738, a difference of 0.050%), Jamaican ($38,670, a difference of 0.12%), Iraqi ($38,666, a difference of 0.13%), and Spaniard ($38,656, a difference of 0.16%).
| Demographics | Rating | Rank | Median Female Earnings |
| Immigrants | Colombia | 16.3 /100 | #205 | Poor $38,913 |
| Immigrants | Bosnia and Herzegovina | 15.6 /100 | #206 | Poor $38,886 |
| Immigrants | Cambodia | 14.2 /100 | #207 | Poor $38,833 |
| Immigrants | Thailand | 13.6 /100 | #208 | Poor $38,810 |
| Norwegians | 13.4 /100 | #209 | Poor $38,802 |
| Czechoslovakians | 12.0 /100 | #210 | Poor $38,738 |
| Aleuts | 11.6 /100 | #211 | Poor $38,719 |
| Guamanians/Chamorros | 11.5 /100 | #212 | Poor $38,717 |
| Jamaicans | 10.5 /100 | #213 | Poor $38,670 |
| Iraqis | 10.5 /100 | #214 | Poor $38,666 |
| Spaniards | 10.3 /100 | #215 | Poor $38,656 |
| Immigrants | Ecuador | 10.1 /100 | #216 | Poor $38,644 |
| Immigrants | Jamaica | 9.7 /100 | #217 | Tragic $38,625 |
| Cape Verdeans | 9.5 /100 | #218 | Tragic $38,614 |
| Nepalese | 9.3 /100 | #219 | Tragic $38,603 |