Trinidadian and Tobagonian vs Nicaraguan Median Family Income
COMPARE
Trinidadian and Tobagonian
Nicaraguan
Median Family Income
Median Family Income Comparison
Trinidadians and Tobagonians
Nicaraguans
$94,466
MEDIAN FAMILY INCOME
1.5/ 100
METRIC RATING
236th/ 347
METRIC RANK
$92,231
MEDIAN FAMILY INCOME
0.5/ 100
METRIC RATING
256th/ 347
METRIC RANK
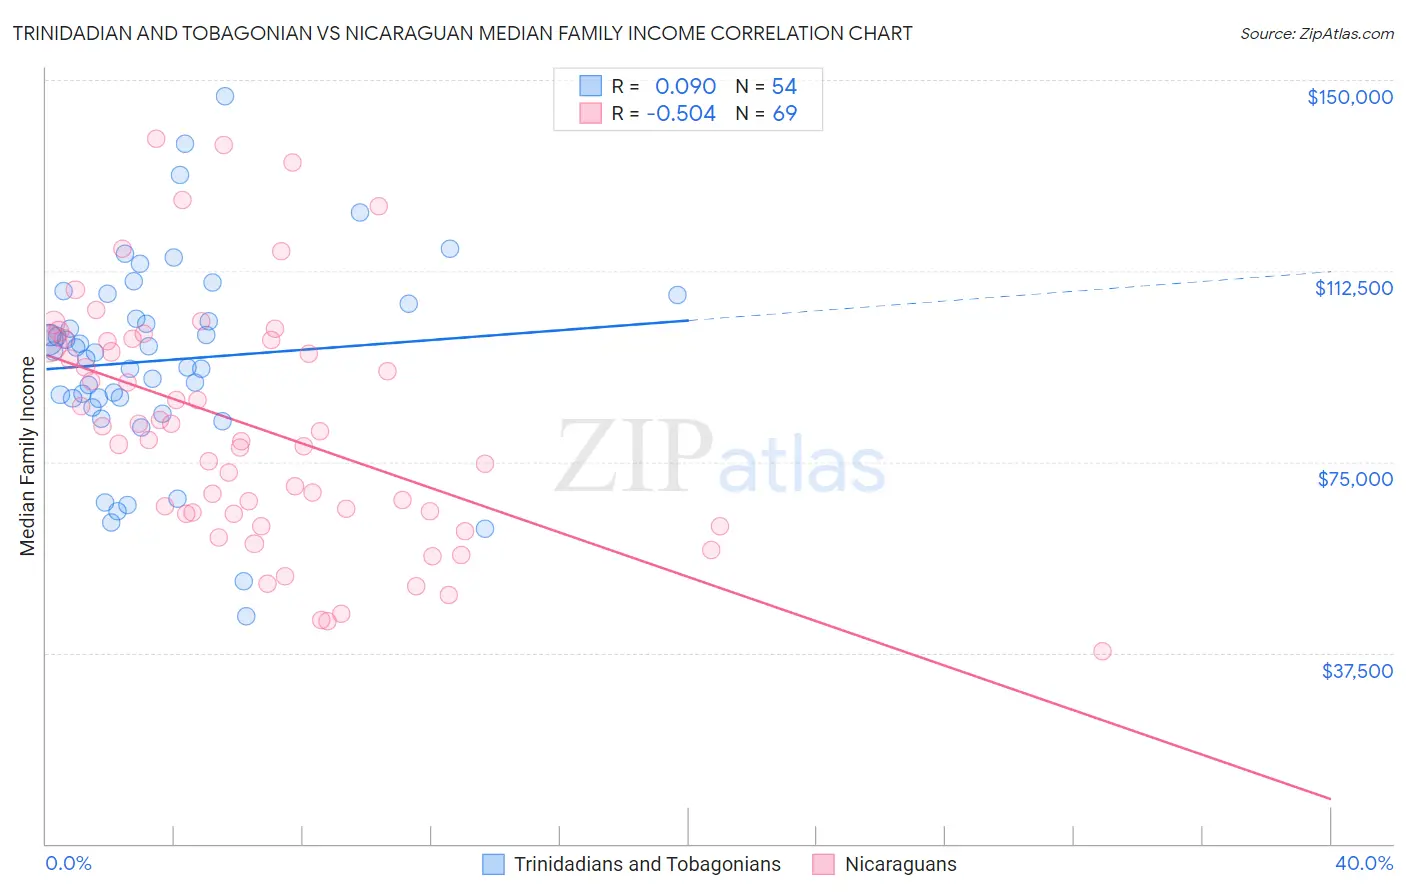
Trinidadian and Tobagonian vs Nicaraguan Median Family Income Correlation Chart
The statistical analysis conducted on geographies consisting of 219,638,345 people shows a slight positive correlation between the proportion of Trinidadians and Tobagonians and median family income in the United States with a correlation coefficient (R) of 0.090 and weighted average of $94,466. Similarly, the statistical analysis conducted on geographies consisting of 285,560,176 people shows a substantial negative correlation between the proportion of Nicaraguans and median family income in the United States with a correlation coefficient (R) of -0.504 and weighted average of $92,231, a difference of 2.4%.
Median Family Income Correlation Summary
| Measurement | Trinidadian and Tobagonian | Nicaraguan |
| Minimum | $44,583 | $37,806 |
| Maximum | $146,767 | $138,531 |
| Range | $102,184 | $100,725 |
| Mean | $94,928 | $81,690 |
| Median | $96,651 | $79,377 |
| Interquartile 25% (IQ1) | $87,494 | $64,820 |
| Interquartile 75% (IQ3) | $106,050 | $98,783 |
| Interquartile Range (IQR) | $18,556 | $33,963 |
| Standard Deviation (Sample) | $19,692 | $23,577 |
| Standard Deviation (Population) | $19,508 | $23,406 |
Demographics Similar to Trinidadians and Tobagonians and Nicaraguans by Median Family Income
In terms of median family income, the demographic groups most similar to Trinidadians and Tobagonians are Alaskan Athabascan ($94,429, a difference of 0.040%), Nepalese ($94,153, a difference of 0.33%), Salvadoran ($94,109, a difference of 0.38%), Somali ($94,085, a difference of 0.40%), and Immigrants from Trinidad and Tobago ($93,988, a difference of 0.51%). Similarly, the demographic groups most similar to Nicaraguans are Immigrants from Laos ($92,239, a difference of 0.010%), Immigrants from Barbados ($92,419, a difference of 0.20%), Immigrants from Guyana ($92,513, a difference of 0.31%), Immigrants from El Salvador ($92,545, a difference of 0.34%), and Immigrants from Somalia ($92,609, a difference of 0.41%).
| Demographics | Rating | Rank | Median Family Income |
| Trinidadians and Tobagonians | 1.5 /100 | #236 | Tragic $94,466 |
| Alaskan Athabascans | 1.5 /100 | #237 | Tragic $94,429 |
| Nepalese | 1.3 /100 | #238 | Tragic $94,153 |
| Salvadorans | 1.2 /100 | #239 | Tragic $94,109 |
| Somalis | 1.2 /100 | #240 | Tragic $94,085 |
| Immigrants | Trinidad and Tobago | 1.2 /100 | #241 | Tragic $93,988 |
| Barbadians | 1.1 /100 | #242 | Tragic $93,919 |
| German Russians | 1.1 /100 | #243 | Tragic $93,858 |
| Sub-Saharan Africans | 1.0 /100 | #244 | Tragic $93,748 |
| Immigrants | Middle Africa | 1.0 /100 | #245 | Tragic $93,593 |
| Guyanese | 0.9 /100 | #246 | Tragic $93,373 |
| Immigrants | Senegal | 0.7 /100 | #247 | Tragic $92,912 |
| French American Indians | 0.7 /100 | #248 | Tragic $92,872 |
| Immigrants | Ecuador | 0.7 /100 | #249 | Tragic $92,837 |
| West Indians | 0.6 /100 | #250 | Tragic $92,765 |
| Immigrants | Somalia | 0.6 /100 | #251 | Tragic $92,609 |
| Immigrants | El Salvador | 0.6 /100 | #252 | Tragic $92,545 |
| Immigrants | Guyana | 0.6 /100 | #253 | Tragic $92,513 |
| Immigrants | Barbados | 0.5 /100 | #254 | Tragic $92,419 |
| Immigrants | Laos | 0.5 /100 | #255 | Tragic $92,239 |
| Nicaraguans | 0.5 /100 | #256 | Tragic $92,231 |