Trinidadian and Tobagonian vs Immigrants from Belarus Median Family Income
COMPARE
Trinidadian and Tobagonian
Immigrants from Belarus
Median Family Income
Median Family Income Comparison
Trinidadians and Tobagonians
Immigrants from Belarus
$94,466
MEDIAN FAMILY INCOME
1.5/ 100
METRIC RATING
236th/ 347
METRIC RANK
$114,586
MEDIAN FAMILY INCOME
99.8/ 100
METRIC RATING
61st/ 347
METRIC RANK
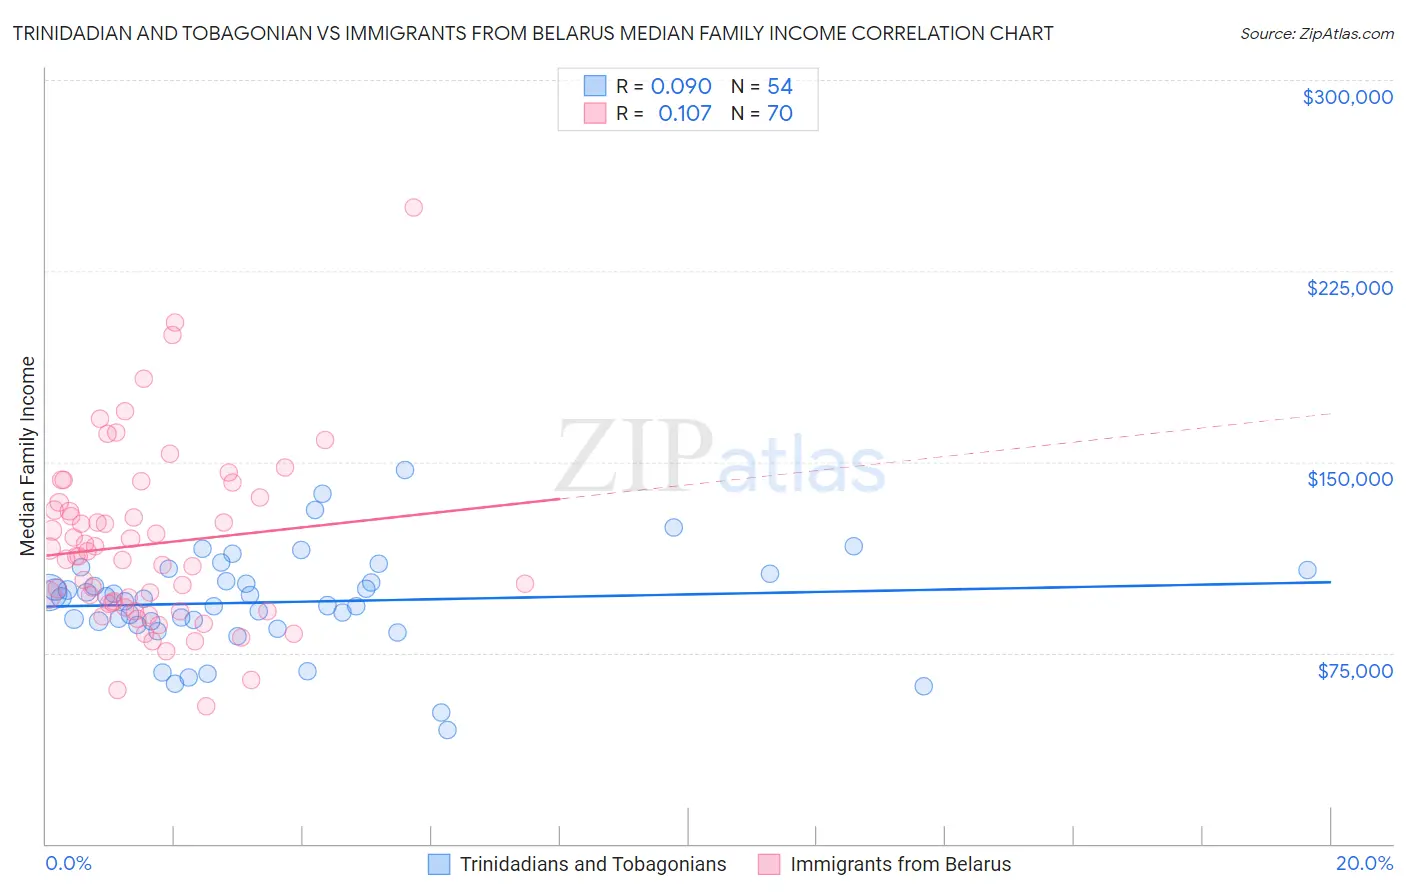
Trinidadian and Tobagonian vs Immigrants from Belarus Median Family Income Correlation Chart
The statistical analysis conducted on geographies consisting of 219,638,345 people shows a slight positive correlation between the proportion of Trinidadians and Tobagonians and median family income in the United States with a correlation coefficient (R) of 0.090 and weighted average of $94,466. Similarly, the statistical analysis conducted on geographies consisting of 150,185,977 people shows a poor positive correlation between the proportion of Immigrants from Belarus and median family income in the United States with a correlation coefficient (R) of 0.107 and weighted average of $114,586, a difference of 21.3%.
Median Family Income Correlation Summary
| Measurement | Trinidadian and Tobagonian | Immigrants from Belarus |
| Minimum | $44,583 | $53,863 |
| Maximum | $146,767 | $250,001 |
| Range | $102,184 | $196,138 |
| Mean | $94,928 | $117,573 |
| Median | $96,651 | $112,923 |
| Interquartile 25% (IQ1) | $87,494 | $92,989 |
| Interquartile 75% (IQ3) | $106,050 | $134,250 |
| Interquartile Range (IQR) | $18,556 | $41,261 |
| Standard Deviation (Sample) | $19,692 | $34,918 |
| Standard Deviation (Population) | $19,508 | $34,668 |
Similar Demographics by Median Family Income
Demographics Similar to Trinidadians and Tobagonians by Median Family Income
In terms of median family income, the demographic groups most similar to Trinidadians and Tobagonians are Immigrants from Burma/Myanmar ($94,472, a difference of 0.010%), Alaskan Athabascan ($94,429, a difference of 0.040%), Immigrants from Western Africa ($94,638, a difference of 0.18%), Immigrants from Bangladesh ($94,665, a difference of 0.21%), and Nepalese ($94,153, a difference of 0.33%).
| Demographics | Rating | Rank | Median Family Income |
| Marshallese | 2.2 /100 | #229 | Tragic $95,293 |
| Malaysians | 2.2 /100 | #230 | Tragic $95,230 |
| Ecuadorians | 2.1 /100 | #231 | Tragic $95,114 |
| Immigrants | Venezuela | 1.9 /100 | #232 | Tragic $94,904 |
| Immigrants | Bangladesh | 1.6 /100 | #233 | Tragic $94,665 |
| Immigrants | Western Africa | 1.6 /100 | #234 | Tragic $94,638 |
| Immigrants | Burma/Myanmar | 1.5 /100 | #235 | Tragic $94,472 |
| Trinidadians and Tobagonians | 1.5 /100 | #236 | Tragic $94,466 |
| Alaskan Athabascans | 1.5 /100 | #237 | Tragic $94,429 |
| Nepalese | 1.3 /100 | #238 | Tragic $94,153 |
| Salvadorans | 1.2 /100 | #239 | Tragic $94,109 |
| Somalis | 1.2 /100 | #240 | Tragic $94,085 |
| Immigrants | Trinidad and Tobago | 1.2 /100 | #241 | Tragic $93,988 |
| Barbadians | 1.1 /100 | #242 | Tragic $93,919 |
| German Russians | 1.1 /100 | #243 | Tragic $93,858 |
Demographics Similar to Immigrants from Belarus by Median Family Income
In terms of median family income, the demographic groups most similar to Immigrants from Belarus are Mongolian ($114,553, a difference of 0.030%), Immigrants from Pakistan ($114,406, a difference of 0.16%), Immigrants from Scotland ($114,392, a difference of 0.17%), Immigrants from Latvia ($114,826, a difference of 0.21%), and Immigrants from Netherlands ($114,987, a difference of 0.35%).
| Demographics | Rating | Rank | Median Family Income |
| Immigrants | Europe | 99.9 /100 | #54 | Exceptional $115,523 |
| Lithuanians | 99.8 /100 | #55 | Exceptional $115,395 |
| New Zealanders | 99.8 /100 | #56 | Exceptional $115,230 |
| Greeks | 99.8 /100 | #57 | Exceptional $115,192 |
| Immigrants | Indonesia | 99.8 /100 | #58 | Exceptional $115,162 |
| Immigrants | Netherlands | 99.8 /100 | #59 | Exceptional $114,987 |
| Immigrants | Latvia | 99.8 /100 | #60 | Exceptional $114,826 |
| Immigrants | Belarus | 99.8 /100 | #61 | Exceptional $114,586 |
| Mongolians | 99.8 /100 | #62 | Exceptional $114,553 |
| Immigrants | Pakistan | 99.8 /100 | #63 | Exceptional $114,406 |
| Immigrants | Scotland | 99.7 /100 | #64 | Exceptional $114,392 |
| Egyptians | 99.7 /100 | #65 | Exceptional $114,119 |
| Paraguayans | 99.7 /100 | #66 | Exceptional $114,016 |
| Immigrants | Spain | 99.7 /100 | #67 | Exceptional $113,815 |
| Immigrants | Serbia | 99.6 /100 | #68 | Exceptional $113,463 |