Trinidadian and Tobagonian vs Immigrants from Laos Family Households with Children
COMPARE
Trinidadian and Tobagonian
Immigrants from Laos
Family Households with Children
Family Households with Children Comparison
Trinidadians and Tobagonians
Immigrants from Laos
26.4%
FAMILY HOUSEHOLDS WITH CHILDREN
0.1/ 100
METRIC RATING
299th/ 347
METRIC RANK
29.8%
FAMILY HOUSEHOLDS WITH CHILDREN
100.0/ 100
METRIC RATING
21st/ 347
METRIC RANK
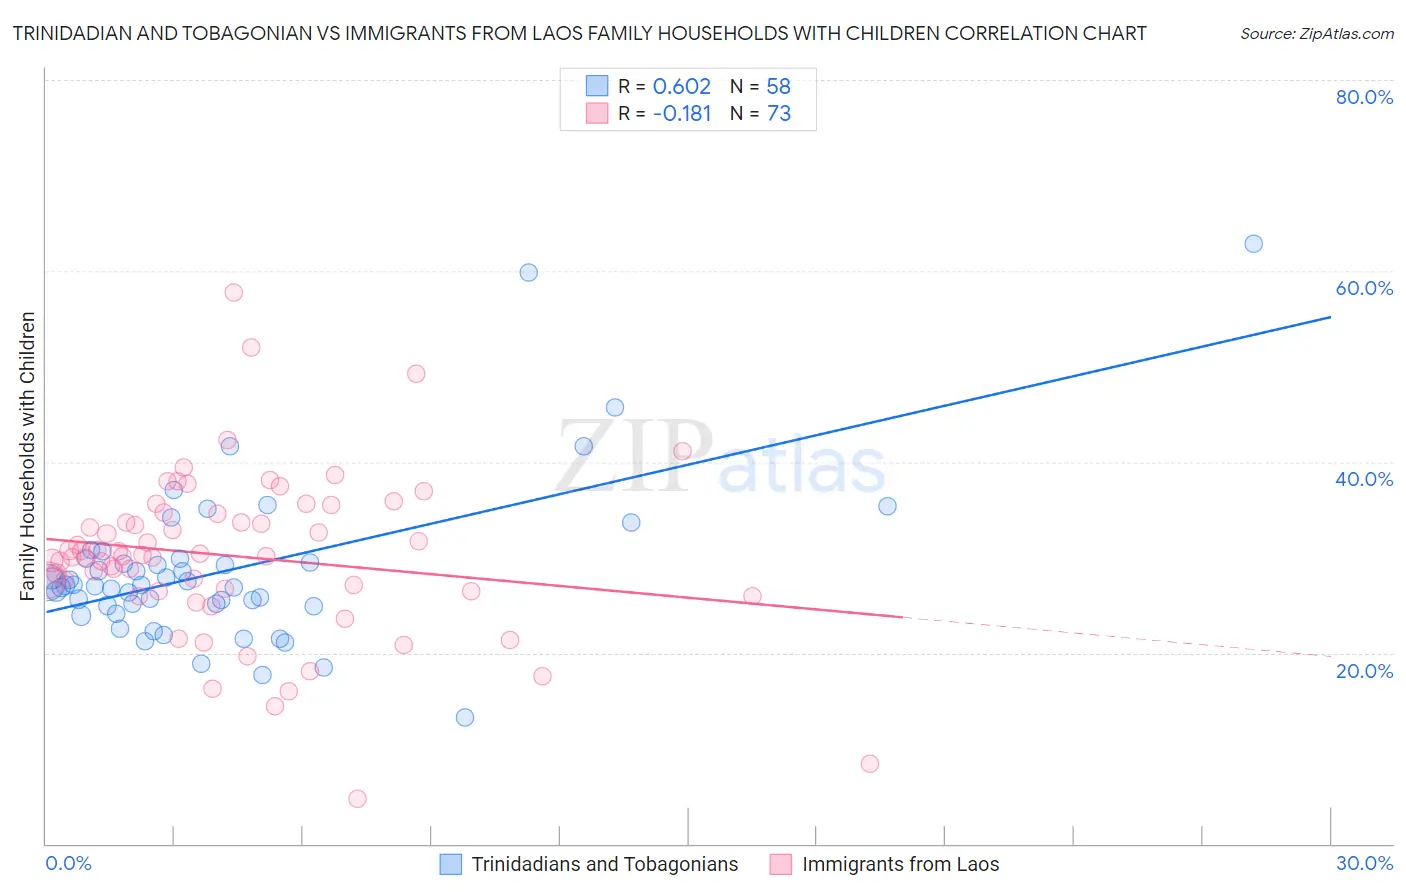
Trinidadian and Tobagonian vs Immigrants from Laos Family Households with Children Correlation Chart
The statistical analysis conducted on geographies consisting of 219,664,488 people shows a significant positive correlation between the proportion of Trinidadians and Tobagonians and percentage of family households with children in the United States with a correlation coefficient (R) of 0.602 and weighted average of 26.4%. Similarly, the statistical analysis conducted on geographies consisting of 201,433,217 people shows a poor negative correlation between the proportion of Immigrants from Laos and percentage of family households with children in the United States with a correlation coefficient (R) of -0.181 and weighted average of 29.8%, a difference of 13.0%.
Family Households with Children Correlation Summary
| Measurement | Trinidadian and Tobagonian | Immigrants from Laos |
| Minimum | 13.3% | 4.8% |
| Maximum | 62.8% | 57.7% |
| Range | 49.5% | 53.0% |
| Mean | 28.7% | 30.1% |
| Median | 27.1% | 30.1% |
| Interquartile 25% (IQ1) | 24.9% | 26.4% |
| Interquartile 75% (IQ3) | 29.8% | 34.6% |
| Interquartile Range (IQR) | 4.9% | 8.2% |
| Standard Deviation (Sample) | 8.5% | 8.6% |
| Standard Deviation (Population) | 8.4% | 8.5% |
Similar Demographics by Family Households with Children
Demographics Similar to Trinidadians and Tobagonians by Family Households with Children
In terms of family households with children, the demographic groups most similar to Trinidadians and Tobagonians are Immigrants from Western Europe (26.4%, a difference of 0.010%), Armenian (26.4%, a difference of 0.11%), Croatian (26.4%, a difference of 0.12%), Paiute (26.4%, a difference of 0.12%), and Macedonian (26.4%, a difference of 0.14%).
| Demographics | Rating | Rank | Family Households with Children |
| Poles | 0.2 /100 | #292 | Tragic 26.5% |
| Blacks/African Americans | 0.1 /100 | #293 | Tragic 26.5% |
| Latvians | 0.1 /100 | #294 | Tragic 26.4% |
| Macedonians | 0.1 /100 | #295 | Tragic 26.4% |
| Croatians | 0.1 /100 | #296 | Tragic 26.4% |
| Armenians | 0.1 /100 | #297 | Tragic 26.4% |
| Immigrants | Western Europe | 0.1 /100 | #298 | Tragic 26.4% |
| Trinidadians and Tobagonians | 0.1 /100 | #299 | Tragic 26.4% |
| Paiute | 0.1 /100 | #300 | Tragic 26.4% |
| Immigrants | Trinidad and Tobago | 0.1 /100 | #301 | Tragic 26.4% |
| Serbians | 0.1 /100 | #302 | Tragic 26.4% |
| Immigrants | Guyana | 0.1 /100 | #303 | Tragic 26.3% |
| Immigrants | Bahamas | 0.1 /100 | #304 | Tragic 26.3% |
| Guyanese | 0.1 /100 | #305 | Tragic 26.3% |
| Bermudans | 0.1 /100 | #306 | Tragic 26.3% |
Demographics Similar to Immigrants from Laos by Family Households with Children
In terms of family households with children, the demographic groups most similar to Immigrants from Laos are Malaysian (29.8%, a difference of 0.030%), Immigrants from El Salvador (29.8%, a difference of 0.040%), Alaska Native (29.9%, a difference of 0.070%), Salvadoran (29.9%, a difference of 0.11%), and Hispanic or Latino (29.9%, a difference of 0.30%).
| Demographics | Rating | Rank | Family Households with Children |
| Bangladeshis | 100.0 /100 | #14 | Exceptional 30.1% |
| Immigrants | South Central Asia | 100.0 /100 | #15 | Exceptional 30.0% |
| Immigrants | Afghanistan | 100.0 /100 | #16 | Exceptional 30.0% |
| Hispanics or Latinos | 100.0 /100 | #17 | Exceptional 29.9% |
| Salvadorans | 100.0 /100 | #18 | Exceptional 29.9% |
| Alaska Natives | 100.0 /100 | #19 | Exceptional 29.9% |
| Immigrants | El Salvador | 100.0 /100 | #20 | Exceptional 29.8% |
| Immigrants | Laos | 100.0 /100 | #21 | Exceptional 29.8% |
| Malaysians | 100.0 /100 | #22 | Exceptional 29.8% |
| Mexican American Indians | 100.0 /100 | #23 | Exceptional 29.7% |
| Guamanians/Chamorros | 100.0 /100 | #24 | Exceptional 29.7% |
| Immigrants | Latin America | 100.0 /100 | #25 | Exceptional 29.7% |
| Sri Lankans | 100.0 /100 | #26 | Exceptional 29.5% |
| Immigrants | Vietnam | 100.0 /100 | #27 | Exceptional 29.5% |
| Samoans | 100.0 /100 | #28 | Exceptional 29.5% |