Trinidadian and Tobagonian vs Immigrants from Japan Median Family Income
COMPARE
Trinidadian and Tobagonian
Immigrants from Japan
Median Family Income
Median Family Income Comparison
Trinidadians and Tobagonians
Immigrants from Japan
$94,466
MEDIAN FAMILY INCOME
1.5/ 100
METRIC RATING
236th/ 347
METRIC RANK
$122,764
MEDIAN FAMILY INCOME
100.0/ 100
METRIC RATING
23rd/ 347
METRIC RANK
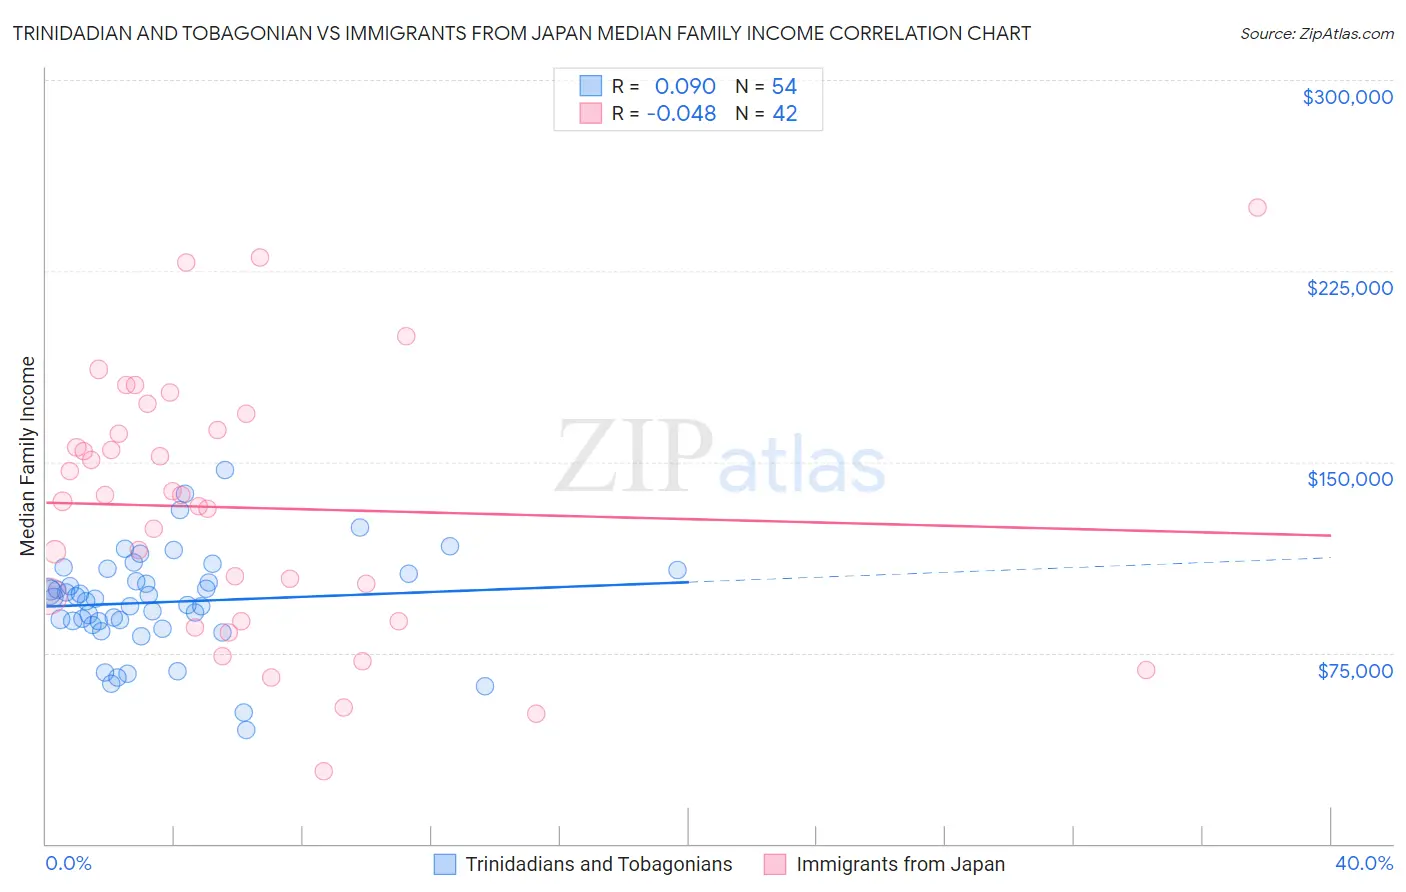
Trinidadian and Tobagonian vs Immigrants from Japan Median Family Income Correlation Chart
The statistical analysis conducted on geographies consisting of 219,638,345 people shows a slight positive correlation between the proportion of Trinidadians and Tobagonians and median family income in the United States with a correlation coefficient (R) of 0.090 and weighted average of $94,466. Similarly, the statistical analysis conducted on geographies consisting of 339,915,551 people shows no correlation between the proportion of Immigrants from Japan and median family income in the United States with a correlation coefficient (R) of -0.048 and weighted average of $122,764, a difference of 30.0%.
Median Family Income Correlation Summary
| Measurement | Trinidadian and Tobagonian | Immigrants from Japan |
| Minimum | $44,583 | $28,538 |
| Maximum | $146,767 | $250,001 |
| Range | $102,184 | $221,463 |
| Mean | $94,928 | $131,921 |
| Median | $96,651 | $135,669 |
| Interquartile 25% (IQ1) | $87,494 | $87,578 |
| Interquartile 75% (IQ3) | $106,050 | $162,396 |
| Interquartile Range (IQR) | $18,556 | $74,818 |
| Standard Deviation (Sample) | $19,692 | $50,889 |
| Standard Deviation (Population) | $19,508 | $50,280 |
Similar Demographics by Median Family Income
Demographics Similar to Trinidadians and Tobagonians by Median Family Income
In terms of median family income, the demographic groups most similar to Trinidadians and Tobagonians are Immigrants from Burma/Myanmar ($94,472, a difference of 0.010%), Alaskan Athabascan ($94,429, a difference of 0.040%), Immigrants from Western Africa ($94,638, a difference of 0.18%), Immigrants from Bangladesh ($94,665, a difference of 0.21%), and Nepalese ($94,153, a difference of 0.33%).
| Demographics | Rating | Rank | Median Family Income |
| Marshallese | 2.2 /100 | #229 | Tragic $95,293 |
| Malaysians | 2.2 /100 | #230 | Tragic $95,230 |
| Ecuadorians | 2.1 /100 | #231 | Tragic $95,114 |
| Immigrants | Venezuela | 1.9 /100 | #232 | Tragic $94,904 |
| Immigrants | Bangladesh | 1.6 /100 | #233 | Tragic $94,665 |
| Immigrants | Western Africa | 1.6 /100 | #234 | Tragic $94,638 |
| Immigrants | Burma/Myanmar | 1.5 /100 | #235 | Tragic $94,472 |
| Trinidadians and Tobagonians | 1.5 /100 | #236 | Tragic $94,466 |
| Alaskan Athabascans | 1.5 /100 | #237 | Tragic $94,429 |
| Nepalese | 1.3 /100 | #238 | Tragic $94,153 |
| Salvadorans | 1.2 /100 | #239 | Tragic $94,109 |
| Somalis | 1.2 /100 | #240 | Tragic $94,085 |
| Immigrants | Trinidad and Tobago | 1.2 /100 | #241 | Tragic $93,988 |
| Barbadians | 1.1 /100 | #242 | Tragic $93,919 |
| German Russians | 1.1 /100 | #243 | Tragic $93,858 |
Demographics Similar to Immigrants from Japan by Median Family Income
In terms of median family income, the demographic groups most similar to Immigrants from Japan are Immigrants from Sweden ($122,765, a difference of 0.0%), Immigrants from Korea ($122,800, a difference of 0.030%), Burmese ($123,369, a difference of 0.49%), Immigrants from Northern Europe ($121,840, a difference of 0.76%), and Immigrants from Belgium ($123,831, a difference of 0.87%).
| Demographics | Rating | Rank | Median Family Income |
| Immigrants | China | 100.0 /100 | #16 | Exceptional $125,540 |
| Indians (Asian) | 100.0 /100 | #17 | Exceptional $125,312 |
| Immigrants | Eastern Asia | 100.0 /100 | #18 | Exceptional $125,150 |
| Immigrants | Belgium | 100.0 /100 | #19 | Exceptional $123,831 |
| Burmese | 100.0 /100 | #20 | Exceptional $123,369 |
| Immigrants | Korea | 100.0 /100 | #21 | Exceptional $122,800 |
| Immigrants | Sweden | 100.0 /100 | #22 | Exceptional $122,765 |
| Immigrants | Japan | 100.0 /100 | #23 | Exceptional $122,764 |
| Immigrants | Northern Europe | 100.0 /100 | #24 | Exceptional $121,840 |
| Turks | 100.0 /100 | #25 | Exceptional $121,202 |
| Immigrants | Switzerland | 100.0 /100 | #26 | Exceptional $120,726 |
| Russians | 100.0 /100 | #27 | Exceptional $120,487 |
| Immigrants | Denmark | 100.0 /100 | #28 | Exceptional $120,445 |
| Latvians | 100.0 /100 | #29 | Exceptional $120,301 |
| Immigrants | Sri Lanka | 100.0 /100 | #30 | Exceptional $120,263 |