Trinidadian and Tobagonian vs Immigrants from Australia Median Family Income
COMPARE
Trinidadian and Tobagonian
Immigrants from Australia
Median Family Income
Median Family Income Comparison
Trinidadians and Tobagonians
Immigrants from Australia
$94,466
MEDIAN FAMILY INCOME
1.5/ 100
METRIC RATING
236th/ 347
METRIC RANK
$126,620
MEDIAN FAMILY INCOME
100.0/ 100
METRIC RATING
13th/ 347
METRIC RANK
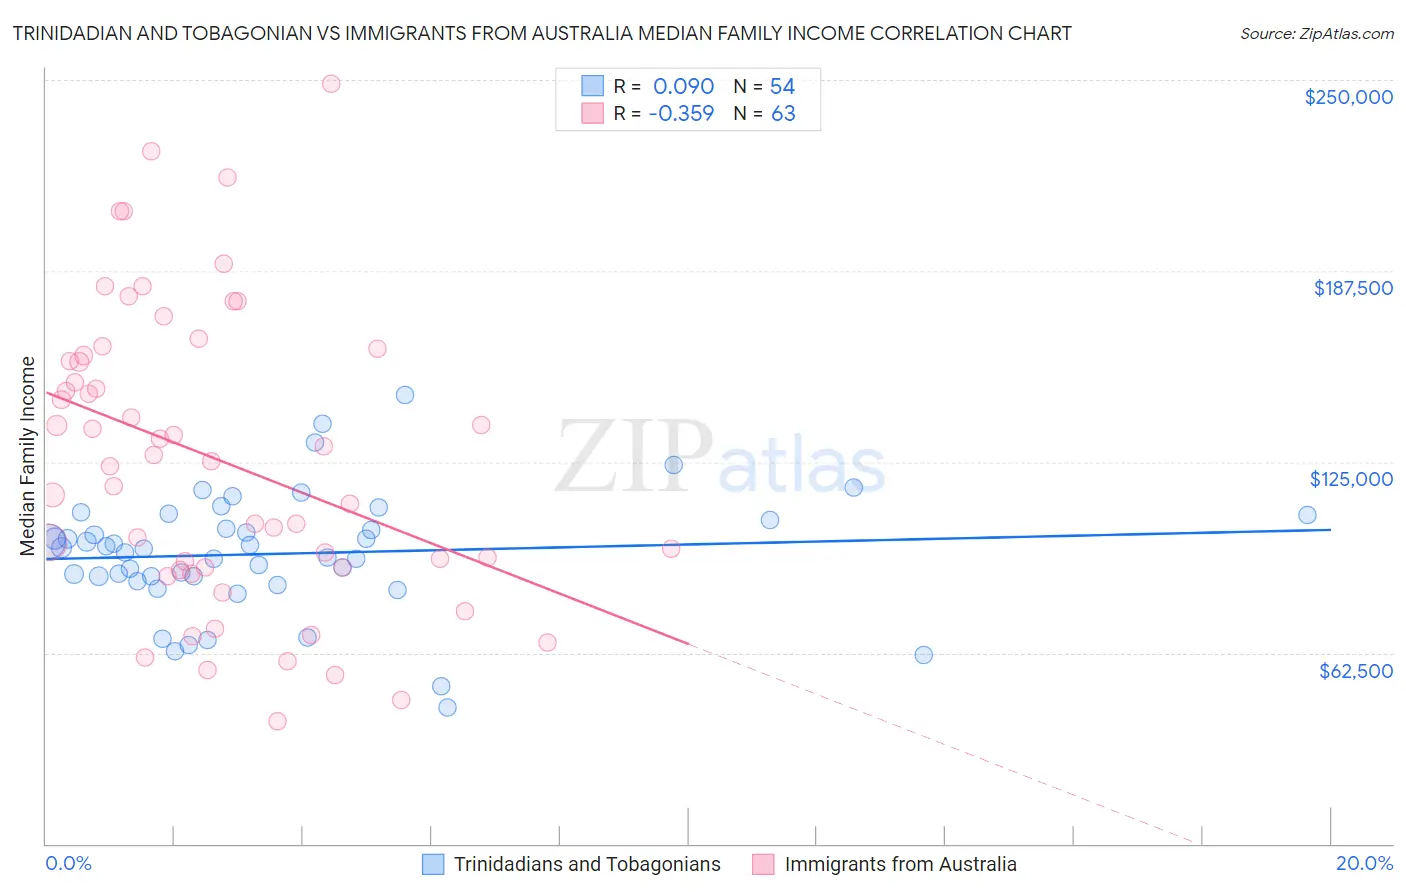
Trinidadian and Tobagonian vs Immigrants from Australia Median Family Income Correlation Chart
The statistical analysis conducted on geographies consisting of 219,638,345 people shows a slight positive correlation between the proportion of Trinidadians and Tobagonians and median family income in the United States with a correlation coefficient (R) of 0.090 and weighted average of $94,466. Similarly, the statistical analysis conducted on geographies consisting of 227,105,113 people shows a mild negative correlation between the proportion of Immigrants from Australia and median family income in the United States with a correlation coefficient (R) of -0.359 and weighted average of $126,620, a difference of 34.0%.
Median Family Income Correlation Summary
| Measurement | Trinidadian and Tobagonian | Immigrants from Australia |
| Minimum | $44,583 | $40,038 |
| Maximum | $146,767 | $248,750 |
| Range | $102,184 | $208,712 |
| Mean | $94,928 | $125,759 |
| Median | $96,651 | $125,053 |
| Interquartile 25% (IQ1) | $87,494 | $90,291 |
| Interquartile 75% (IQ3) | $106,050 | $159,793 |
| Interquartile Range (IQR) | $18,556 | $69,502 |
| Standard Deviation (Sample) | $19,692 | $48,023 |
| Standard Deviation (Population) | $19,508 | $47,640 |
Similar Demographics by Median Family Income
Demographics Similar to Trinidadians and Tobagonians by Median Family Income
In terms of median family income, the demographic groups most similar to Trinidadians and Tobagonians are Immigrants from Burma/Myanmar ($94,472, a difference of 0.010%), Alaskan Athabascan ($94,429, a difference of 0.040%), Immigrants from Western Africa ($94,638, a difference of 0.18%), Immigrants from Bangladesh ($94,665, a difference of 0.21%), and Nepalese ($94,153, a difference of 0.33%).
| Demographics | Rating | Rank | Median Family Income |
| Marshallese | 2.2 /100 | #229 | Tragic $95,293 |
| Malaysians | 2.2 /100 | #230 | Tragic $95,230 |
| Ecuadorians | 2.1 /100 | #231 | Tragic $95,114 |
| Immigrants | Venezuela | 1.9 /100 | #232 | Tragic $94,904 |
| Immigrants | Bangladesh | 1.6 /100 | #233 | Tragic $94,665 |
| Immigrants | Western Africa | 1.6 /100 | #234 | Tragic $94,638 |
| Immigrants | Burma/Myanmar | 1.5 /100 | #235 | Tragic $94,472 |
| Trinidadians and Tobagonians | 1.5 /100 | #236 | Tragic $94,466 |
| Alaskan Athabascans | 1.5 /100 | #237 | Tragic $94,429 |
| Nepalese | 1.3 /100 | #238 | Tragic $94,153 |
| Salvadorans | 1.2 /100 | #239 | Tragic $94,109 |
| Somalis | 1.2 /100 | #240 | Tragic $94,085 |
| Immigrants | Trinidad and Tobago | 1.2 /100 | #241 | Tragic $93,988 |
| Barbadians | 1.1 /100 | #242 | Tragic $93,919 |
| German Russians | 1.1 /100 | #243 | Tragic $93,858 |
Demographics Similar to Immigrants from Australia by Median Family Income
In terms of median family income, the demographic groups most similar to Immigrants from Australia are Cypriot ($127,064, a difference of 0.35%), Immigrants from South Central Asia ($125,956, a difference of 0.53%), Immigrants from Israel ($127,430, a difference of 0.64%), Immigrants from Ireland ($127,584, a difference of 0.76%), and Eastern European ($125,546, a difference of 0.86%).
| Demographics | Rating | Rank | Median Family Income |
| Thais | 100.0 /100 | #6 | Exceptional $131,281 |
| Immigrants | Hong Kong | 100.0 /100 | #7 | Exceptional $131,067 |
| Immigrants | Iran | 100.0 /100 | #8 | Exceptional $130,894 |
| Okinawans | 100.0 /100 | #9 | Exceptional $129,979 |
| Immigrants | Ireland | 100.0 /100 | #10 | Exceptional $127,584 |
| Immigrants | Israel | 100.0 /100 | #11 | Exceptional $127,430 |
| Cypriots | 100.0 /100 | #12 | Exceptional $127,064 |
| Immigrants | Australia | 100.0 /100 | #13 | Exceptional $126,620 |
| Immigrants | South Central Asia | 100.0 /100 | #14 | Exceptional $125,956 |
| Eastern Europeans | 100.0 /100 | #15 | Exceptional $125,546 |
| Immigrants | China | 100.0 /100 | #16 | Exceptional $125,540 |
| Indians (Asian) | 100.0 /100 | #17 | Exceptional $125,312 |
| Immigrants | Eastern Asia | 100.0 /100 | #18 | Exceptional $125,150 |
| Immigrants | Belgium | 100.0 /100 | #19 | Exceptional $123,831 |
| Burmese | 100.0 /100 | #20 | Exceptional $123,369 |