Immigrants from Burma/Myanmar vs Immigrants from Belarus Median Family Income
COMPARE
Immigrants from Burma/Myanmar
Immigrants from Belarus
Median Family Income
Median Family Income Comparison
Immigrants from Burma/Myanmar
Immigrants from Belarus
$94,472
MEDIAN FAMILY INCOME
1.5/ 100
METRIC RATING
235th/ 347
METRIC RANK
$114,586
MEDIAN FAMILY INCOME
99.8/ 100
METRIC RATING
61st/ 347
METRIC RANK
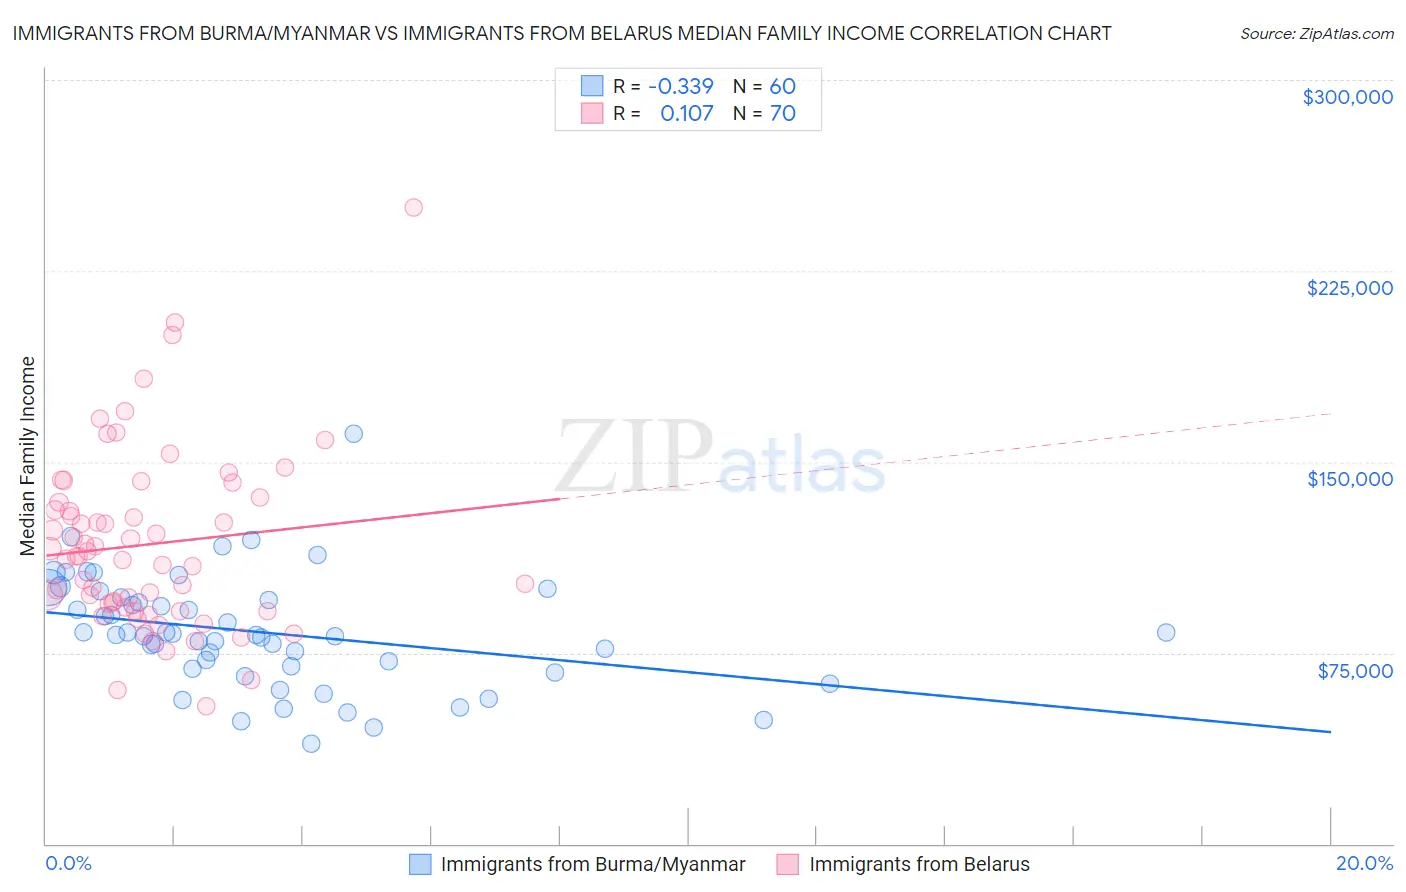
Immigrants from Burma/Myanmar vs Immigrants from Belarus Median Family Income Correlation Chart
The statistical analysis conducted on geographies consisting of 172,231,822 people shows a mild negative correlation between the proportion of Immigrants from Burma/Myanmar and median family income in the United States with a correlation coefficient (R) of -0.339 and weighted average of $94,472. Similarly, the statistical analysis conducted on geographies consisting of 150,185,977 people shows a poor positive correlation between the proportion of Immigrants from Belarus and median family income in the United States with a correlation coefficient (R) of 0.107 and weighted average of $114,586, a difference of 21.3%.
Median Family Income Correlation Summary
| Measurement | Immigrants from Burma/Myanmar | Immigrants from Belarus |
| Minimum | $39,136 | $53,863 |
| Maximum | $160,863 | $250,001 |
| Range | $121,727 | $196,138 |
| Mean | $83,083 | $117,573 |
| Median | $82,122 | $112,923 |
| Interquartile 25% (IQ1) | $69,331 | $92,989 |
| Interquartile 75% (IQ3) | $96,286 | $134,250 |
| Interquartile Range (IQR) | $26,955 | $41,261 |
| Standard Deviation (Sample) | $21,974 | $34,918 |
| Standard Deviation (Population) | $21,790 | $34,668 |
Similar Demographics by Median Family Income
Demographics Similar to Immigrants from Burma/Myanmar by Median Family Income
In terms of median family income, the demographic groups most similar to Immigrants from Burma/Myanmar are Trinidadian and Tobagonian ($94,466, a difference of 0.010%), Alaskan Athabascan ($94,429, a difference of 0.040%), Immigrants from Western Africa ($94,638, a difference of 0.18%), Immigrants from Bangladesh ($94,665, a difference of 0.20%), and Nepalese ($94,153, a difference of 0.34%).
| Demographics | Rating | Rank | Median Family Income |
| Immigrants | Azores | 2.4 /100 | #228 | Tragic $95,402 |
| Marshallese | 2.2 /100 | #229 | Tragic $95,293 |
| Malaysians | 2.2 /100 | #230 | Tragic $95,230 |
| Ecuadorians | 2.1 /100 | #231 | Tragic $95,114 |
| Immigrants | Venezuela | 1.9 /100 | #232 | Tragic $94,904 |
| Immigrants | Bangladesh | 1.6 /100 | #233 | Tragic $94,665 |
| Immigrants | Western Africa | 1.6 /100 | #234 | Tragic $94,638 |
| Immigrants | Burma/Myanmar | 1.5 /100 | #235 | Tragic $94,472 |
| Trinidadians and Tobagonians | 1.5 /100 | #236 | Tragic $94,466 |
| Alaskan Athabascans | 1.5 /100 | #237 | Tragic $94,429 |
| Nepalese | 1.3 /100 | #238 | Tragic $94,153 |
| Salvadorans | 1.2 /100 | #239 | Tragic $94,109 |
| Somalis | 1.2 /100 | #240 | Tragic $94,085 |
| Immigrants | Trinidad and Tobago | 1.2 /100 | #241 | Tragic $93,988 |
| Barbadians | 1.1 /100 | #242 | Tragic $93,919 |
Demographics Similar to Immigrants from Belarus by Median Family Income
In terms of median family income, the demographic groups most similar to Immigrants from Belarus are Mongolian ($114,553, a difference of 0.030%), Immigrants from Pakistan ($114,406, a difference of 0.16%), Immigrants from Scotland ($114,392, a difference of 0.17%), Immigrants from Latvia ($114,826, a difference of 0.21%), and Immigrants from Netherlands ($114,987, a difference of 0.35%).
| Demographics | Rating | Rank | Median Family Income |
| Immigrants | Europe | 99.9 /100 | #54 | Exceptional $115,523 |
| Lithuanians | 99.8 /100 | #55 | Exceptional $115,395 |
| New Zealanders | 99.8 /100 | #56 | Exceptional $115,230 |
| Greeks | 99.8 /100 | #57 | Exceptional $115,192 |
| Immigrants | Indonesia | 99.8 /100 | #58 | Exceptional $115,162 |
| Immigrants | Netherlands | 99.8 /100 | #59 | Exceptional $114,987 |
| Immigrants | Latvia | 99.8 /100 | #60 | Exceptional $114,826 |
| Immigrants | Belarus | 99.8 /100 | #61 | Exceptional $114,586 |
| Mongolians | 99.8 /100 | #62 | Exceptional $114,553 |
| Immigrants | Pakistan | 99.8 /100 | #63 | Exceptional $114,406 |
| Immigrants | Scotland | 99.7 /100 | #64 | Exceptional $114,392 |
| Egyptians | 99.7 /100 | #65 | Exceptional $114,119 |
| Paraguayans | 99.7 /100 | #66 | Exceptional $114,016 |
| Immigrants | Spain | 99.7 /100 | #67 | Exceptional $113,815 |
| Immigrants | Serbia | 99.6 /100 | #68 | Exceptional $113,463 |