Ottawa vs Immigrants from Belarus Median Family Income
COMPARE
Ottawa
Immigrants from Belarus
Median Family Income
Median Family Income Comparison
Ottawa
Immigrants from Belarus
$86,380
MEDIAN FAMILY INCOME
0.0/ 100
METRIC RATING
300th/ 347
METRIC RANK
$114,586
MEDIAN FAMILY INCOME
99.8/ 100
METRIC RATING
61st/ 347
METRIC RANK
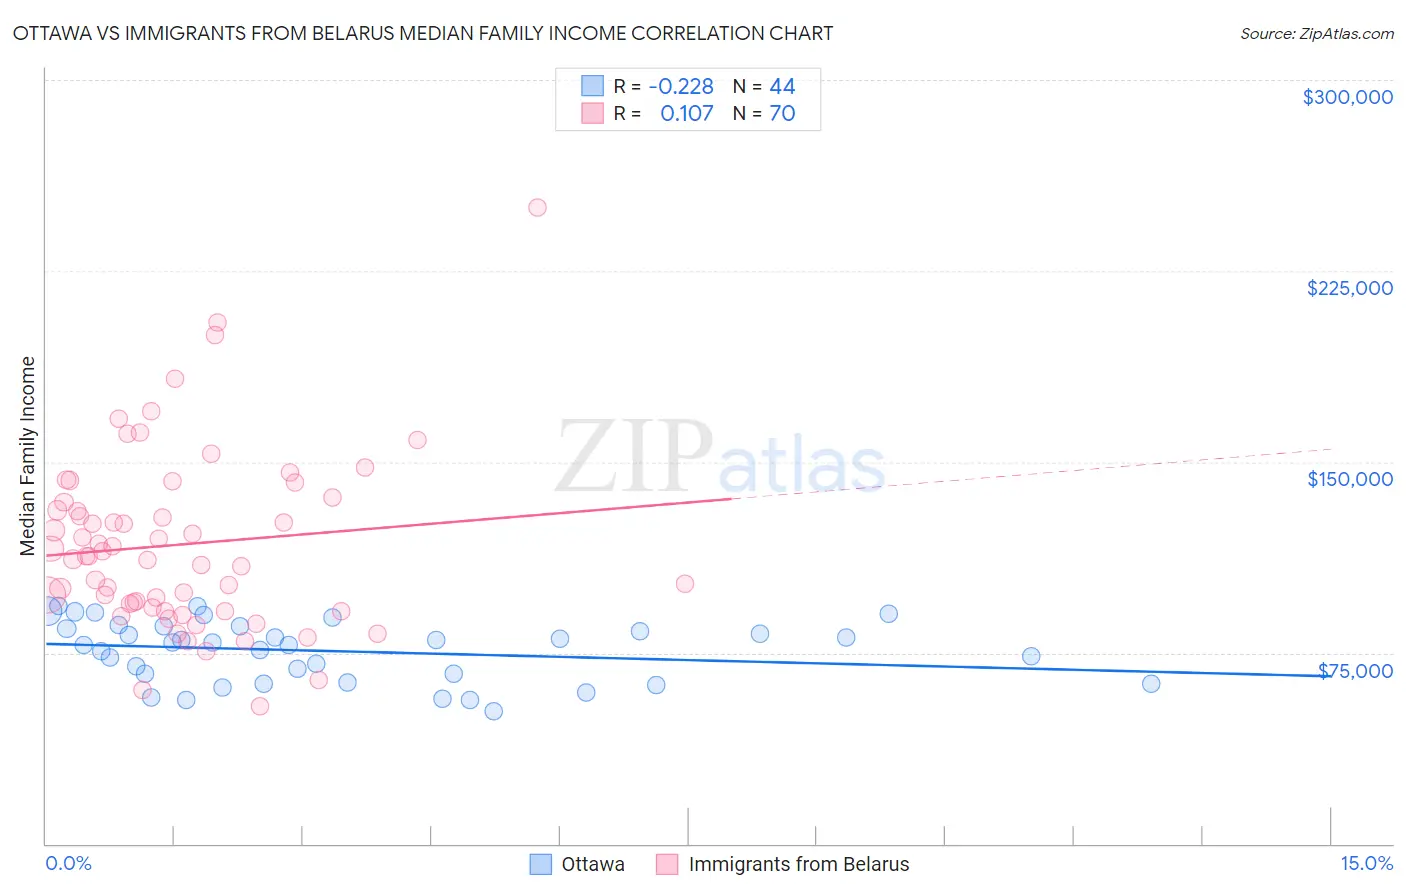
Ottawa vs Immigrants from Belarus Median Family Income Correlation Chart
The statistical analysis conducted on geographies consisting of 49,943,189 people shows a weak negative correlation between the proportion of Ottawa and median family income in the United States with a correlation coefficient (R) of -0.228 and weighted average of $86,380. Similarly, the statistical analysis conducted on geographies consisting of 150,185,977 people shows a poor positive correlation between the proportion of Immigrants from Belarus and median family income in the United States with a correlation coefficient (R) of 0.107 and weighted average of $114,586, a difference of 32.7%.
Median Family Income Correlation Summary
| Measurement | Ottawa | Immigrants from Belarus |
| Minimum | $52,125 | $53,863 |
| Maximum | $93,380 | $250,001 |
| Range | $41,255 | $196,138 |
| Mean | $75,597 | $117,573 |
| Median | $78,416 | $112,923 |
| Interquartile 25% (IQ1) | $64,972 | $92,989 |
| Interquartile 75% (IQ3) | $84,864 | $134,250 |
| Interquartile Range (IQR) | $19,892 | $41,261 |
| Standard Deviation (Sample) | $11,825 | $34,918 |
| Standard Deviation (Population) | $11,690 | $34,668 |
Similar Demographics by Median Family Income
Demographics Similar to Ottawa by Median Family Income
In terms of median family income, the demographic groups most similar to Ottawa are Chippewa ($86,852, a difference of 0.55%), Colville ($85,792, a difference of 0.69%), Immigrants from Latin America ($86,989, a difference of 0.71%), Spanish American Indian ($85,728, a difference of 0.76%), and Hispanic or Latino ($85,647, a difference of 0.86%).
| Demographics | Rating | Rank | Median Family Income |
| Ute | 0.0 /100 | #293 | Tragic $87,596 |
| Fijians | 0.0 /100 | #294 | Tragic $87,387 |
| Yaqui | 0.0 /100 | #295 | Tragic $87,289 |
| Immigrants | Guatemala | 0.0 /100 | #296 | Tragic $87,191 |
| Cajuns | 0.0 /100 | #297 | Tragic $87,157 |
| Immigrants | Latin America | 0.0 /100 | #298 | Tragic $86,989 |
| Chippewa | 0.0 /100 | #299 | Tragic $86,852 |
| Ottawa | 0.0 /100 | #300 | Tragic $86,380 |
| Colville | 0.0 /100 | #301 | Tragic $85,792 |
| Spanish American Indians | 0.0 /100 | #302 | Tragic $85,728 |
| Hispanics or Latinos | 0.0 /100 | #303 | Tragic $85,647 |
| Mexicans | 0.0 /100 | #304 | Tragic $85,618 |
| Paiute | 0.0 /100 | #305 | Tragic $85,414 |
| Immigrants | Dominica | 0.0 /100 | #306 | Tragic $85,411 |
| Chickasaw | 0.0 /100 | #307 | Tragic $85,356 |
Demographics Similar to Immigrants from Belarus by Median Family Income
In terms of median family income, the demographic groups most similar to Immigrants from Belarus are Mongolian ($114,553, a difference of 0.030%), Immigrants from Pakistan ($114,406, a difference of 0.16%), Immigrants from Scotland ($114,392, a difference of 0.17%), Immigrants from Latvia ($114,826, a difference of 0.21%), and Immigrants from Netherlands ($114,987, a difference of 0.35%).
| Demographics | Rating | Rank | Median Family Income |
| Immigrants | Europe | 99.9 /100 | #54 | Exceptional $115,523 |
| Lithuanians | 99.8 /100 | #55 | Exceptional $115,395 |
| New Zealanders | 99.8 /100 | #56 | Exceptional $115,230 |
| Greeks | 99.8 /100 | #57 | Exceptional $115,192 |
| Immigrants | Indonesia | 99.8 /100 | #58 | Exceptional $115,162 |
| Immigrants | Netherlands | 99.8 /100 | #59 | Exceptional $114,987 |
| Immigrants | Latvia | 99.8 /100 | #60 | Exceptional $114,826 |
| Immigrants | Belarus | 99.8 /100 | #61 | Exceptional $114,586 |
| Mongolians | 99.8 /100 | #62 | Exceptional $114,553 |
| Immigrants | Pakistan | 99.8 /100 | #63 | Exceptional $114,406 |
| Immigrants | Scotland | 99.7 /100 | #64 | Exceptional $114,392 |
| Egyptians | 99.7 /100 | #65 | Exceptional $114,119 |
| Paraguayans | 99.7 /100 | #66 | Exceptional $114,016 |
| Immigrants | Spain | 99.7 /100 | #67 | Exceptional $113,815 |
| Immigrants | Serbia | 99.6 /100 | #68 | Exceptional $113,463 |