Trinidadian and Tobagonian vs Immigrants from Belarus Unemployment Among Women with Children Ages 6 to 17 years
COMPARE
Trinidadian and Tobagonian
Immigrants from Belarus
Unemployment Among Women with Children Ages 6 to 17 years
Unemployment Among Women with Children Ages 6 to 17 years Comparison
Trinidadians and Tobagonians
Immigrants from Belarus
9.1%
UNEMPLOYMENT AMONG WOMEN WITH CHILDREN AGES 6 TO 17 YEARS
18.2/ 100
METRIC RATING
200th/ 347
METRIC RANK
8.4%
UNEMPLOYMENT AMONG WOMEN WITH CHILDREN AGES 6 TO 17 YEARS
99.6/ 100
METRIC RATING
80th/ 347
METRIC RANK
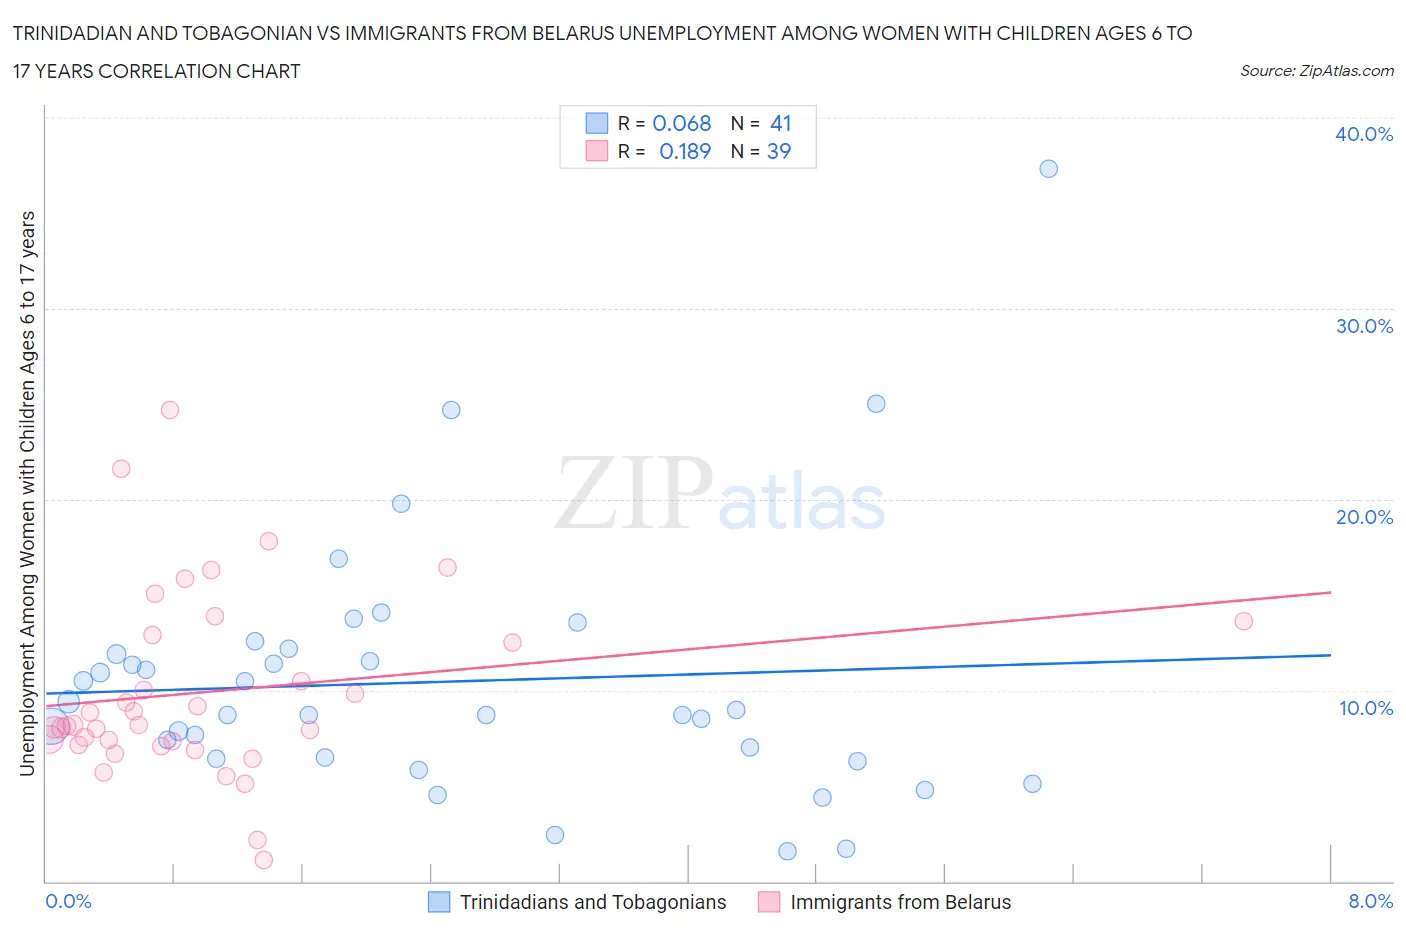
Trinidadian and Tobagonian vs Immigrants from Belarus Unemployment Among Women with Children Ages 6 to 17 years Correlation Chart
The statistical analysis conducted on geographies consisting of 177,682,071 people shows a slight positive correlation between the proportion of Trinidadians and Tobagonians and unemployment rate among women with children between the ages 6 and 17 in the United States with a correlation coefficient (R) of 0.068 and weighted average of 9.1%. Similarly, the statistical analysis conducted on geographies consisting of 123,184,554 people shows a poor positive correlation between the proportion of Immigrants from Belarus and unemployment rate among women with children between the ages 6 and 17 in the United States with a correlation coefficient (R) of 0.189 and weighted average of 8.4%, a difference of 8.4%.
Unemployment Among Women with Children Ages 6 to 17 years Correlation Summary
| Measurement | Trinidadian and Tobagonian | Immigrants from Belarus |
| Minimum | 1.6% | 1.1% |
| Maximum | 37.3% | 24.7% |
| Range | 35.7% | 23.6% |
| Mean | 10.4% | 9.9% |
| Median | 8.7% | 8.2% |
| Interquartile 25% (IQ1) | 6.4% | 7.1% |
| Interquartile 75% (IQ3) | 12.0% | 12.9% |
| Interquartile Range (IQR) | 5.6% | 5.7% |
| Standard Deviation (Sample) | 6.7% | 4.9% |
| Standard Deviation (Population) | 6.6% | 4.8% |
Similar Demographics by Unemployment Among Women with Children Ages 6 to 17 years
Demographics Similar to Trinidadians and Tobagonians by Unemployment Among Women with Children Ages 6 to 17 years
In terms of unemployment among women with children ages 6 to 17 years, the demographic groups most similar to Trinidadians and Tobagonians are Immigrants from Trinidad and Tobago (9.1%, a difference of 0.11%), Czechoslovakian (9.1%, a difference of 0.18%), Immigrants from Middle Africa (9.1%, a difference of 0.20%), Maltese (9.1%, a difference of 0.22%), and Immigrants from Canada (9.1%, a difference of 0.23%).
| Demographics | Rating | Rank | Unemployment Among Women with Children Ages 6 to 17 years |
| Immigrants | Turkey | 25.8 /100 | #193 | Fair 9.1% |
| Immigrants | Kazakhstan | 25.3 /100 | #194 | Fair 9.1% |
| Austrians | 25.0 /100 | #195 | Fair 9.1% |
| Brazilians | 24.4 /100 | #196 | Fair 9.1% |
| Immigrants | Panama | 24.3 /100 | #197 | Fair 9.1% |
| Guyanese | 21.8 /100 | #198 | Fair 9.1% |
| Czechoslovakians | 20.8 /100 | #199 | Fair 9.1% |
| Trinidadians and Tobagonians | 18.2 /100 | #200 | Poor 9.1% |
| Immigrants | Trinidad and Tobago | 16.7 /100 | #201 | Poor 9.1% |
| Immigrants | Middle Africa | 15.6 /100 | #202 | Poor 9.1% |
| Maltese | 15.3 /100 | #203 | Poor 9.1% |
| Immigrants | Canada | 15.3 /100 | #204 | Poor 9.1% |
| Immigrants | Western Europe | 14.1 /100 | #205 | Poor 9.1% |
| Immigrants | North America | 12.7 /100 | #206 | Poor 9.2% |
| Cubans | 10.9 /100 | #207 | Poor 9.2% |
Demographics Similar to Immigrants from Belarus by Unemployment Among Women with Children Ages 6 to 17 years
In terms of unemployment among women with children ages 6 to 17 years, the demographic groups most similar to Immigrants from Belarus are Mongolian (8.4%, a difference of 0.040%), Pakistani (8.4%, a difference of 0.050%), Immigrants from Bolivia (8.4%, a difference of 0.12%), Cypriot (8.4%, a difference of 0.14%), and Iraqi (8.4%, a difference of 0.18%).
| Demographics | Rating | Rank | Unemployment Among Women with Children Ages 6 to 17 years |
| Spanish Americans | 99.8 /100 | #73 | Exceptional 8.4% |
| Samoans | 99.7 /100 | #74 | Exceptional 8.4% |
| Immigrants | Sri Lanka | 99.7 /100 | #75 | Exceptional 8.4% |
| Immigrants | Moldova | 99.7 /100 | #76 | Exceptional 8.4% |
| Iraqis | 99.7 /100 | #77 | Exceptional 8.4% |
| Pakistanis | 99.6 /100 | #78 | Exceptional 8.4% |
| Mongolians | 99.6 /100 | #79 | Exceptional 8.4% |
| Immigrants | Belarus | 99.6 /100 | #80 | Exceptional 8.4% |
| Immigrants | Bolivia | 99.6 /100 | #81 | Exceptional 8.4% |
| Cypriots | 99.6 /100 | #82 | Exceptional 8.4% |
| Bulgarians | 99.5 /100 | #83 | Exceptional 8.4% |
| Japanese | 99.5 /100 | #84 | Exceptional 8.4% |
| Immigrants | North Macedonia | 99.4 /100 | #85 | Exceptional 8.5% |
| Alaskan Athabascans | 99.4 /100 | #86 | Exceptional 8.5% |
| Immigrants | Israel | 99.1 /100 | #87 | Exceptional 8.5% |