Immigrants from Fiji vs Guamanian/Chamorro Median Female Earnings
COMPARE
Immigrants from Fiji
Guamanian/Chamorro
Median Female Earnings
Median Female Earnings Comparison
Immigrants from Fiji
Guamanians/Chamorros
$41,656
MEDIAN FEMALE EARNINGS
98.3/ 100
METRIC RATING
101st/ 347
METRIC RANK
$38,717
MEDIAN FEMALE EARNINGS
11.5/ 100
METRIC RATING
212th/ 347
METRIC RANK
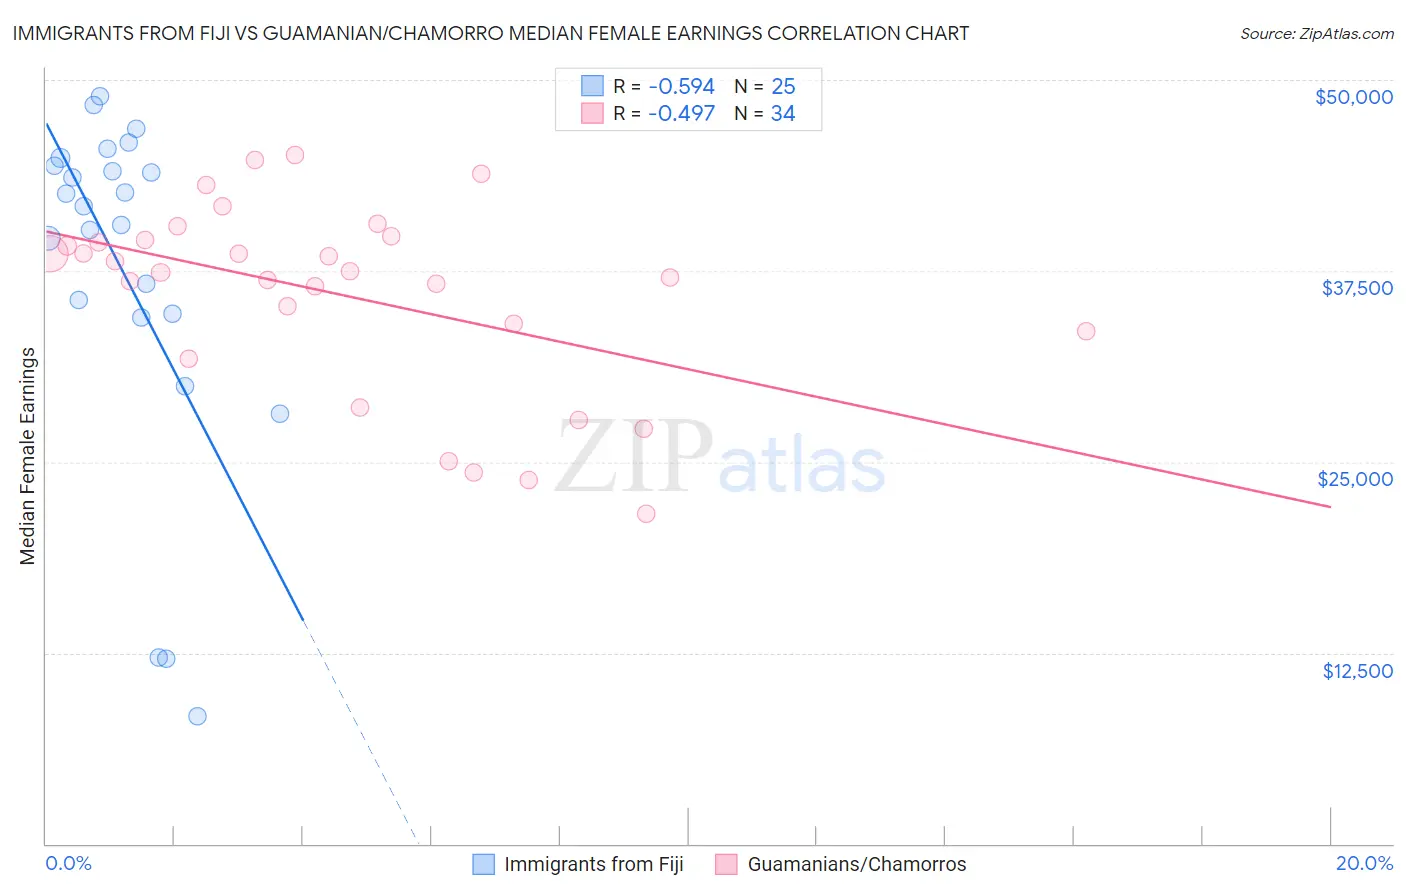
Immigrants from Fiji vs Guamanian/Chamorro Median Female Earnings Correlation Chart
The statistical analysis conducted on geographies consisting of 93,750,474 people shows a substantial negative correlation between the proportion of Immigrants from Fiji and median female earnings in the United States with a correlation coefficient (R) of -0.594 and weighted average of $41,656. Similarly, the statistical analysis conducted on geographies consisting of 221,909,570 people shows a moderate negative correlation between the proportion of Guamanians/Chamorros and median female earnings in the United States with a correlation coefficient (R) of -0.497 and weighted average of $38,717, a difference of 7.6%.
Median Female Earnings Correlation Summary
| Measurement | Immigrants from Fiji | Guamanian/Chamorro |
| Minimum | $8,380 | $21,607 |
| Maximum | $48,941 | $45,111 |
| Range | $40,561 | $23,504 |
| Mean | $37,439 | $35,932 |
| Median | $41,723 | $37,420 |
| Interquartile 25% (IQ1) | $34,596 | $33,542 |
| Interquartile 75% (IQ3) | $44,642 | $39,523 |
| Interquartile Range (IQR) | $10,046 | $5,981 |
| Standard Deviation (Sample) | $11,332 | $6,215 |
| Standard Deviation (Population) | $11,103 | $6,122 |
Similar Demographics by Median Female Earnings
Demographics Similar to Immigrants from Fiji by Median Female Earnings
In terms of median female earnings, the demographic groups most similar to Immigrants from Fiji are Romanian ($41,663, a difference of 0.020%), Immigrants from Poland ($41,630, a difference of 0.060%), Immigrants from Barbados ($41,685, a difference of 0.070%), Immigrants from Argentina ($41,554, a difference of 0.25%), and Immigrants from Scotland ($41,771, a difference of 0.28%).
| Demographics | Rating | Rank | Median Female Earnings |
| Moroccans | 98.9 /100 | #94 | Exceptional $41,872 |
| Immigrants | Netherlands | 98.9 /100 | #95 | Exceptional $41,870 |
| South Africans | 98.8 /100 | #96 | Exceptional $41,825 |
| Immigrants | Hungary | 98.8 /100 | #97 | Exceptional $41,820 |
| Immigrants | Scotland | 98.7 /100 | #98 | Exceptional $41,771 |
| Immigrants | Barbados | 98.4 /100 | #99 | Exceptional $41,685 |
| Romanians | 98.3 /100 | #100 | Exceptional $41,663 |
| Immigrants | Fiji | 98.3 /100 | #101 | Exceptional $41,656 |
| Immigrants | Poland | 98.2 /100 | #102 | Exceptional $41,630 |
| Immigrants | Argentina | 97.9 /100 | #103 | Exceptional $41,554 |
| Immigrants | Zimbabwe | 97.8 /100 | #104 | Exceptional $41,527 |
| Italians | 97.7 /100 | #105 | Exceptional $41,505 |
| Immigrants | Eritrea | 97.6 /100 | #106 | Exceptional $41,485 |
| Palestinians | 97.6 /100 | #107 | Exceptional $41,484 |
| Jordanians | 97.5 /100 | #108 | Exceptional $41,464 |
Demographics Similar to Guamanians/Chamorros by Median Female Earnings
In terms of median female earnings, the demographic groups most similar to Guamanians/Chamorros are Aleut ($38,719, a difference of 0.010%), Czechoslovakian ($38,738, a difference of 0.050%), Jamaican ($38,670, a difference of 0.12%), Iraqi ($38,666, a difference of 0.13%), and Spaniard ($38,656, a difference of 0.16%).
| Demographics | Rating | Rank | Median Female Earnings |
| Immigrants | Colombia | 16.3 /100 | #205 | Poor $38,913 |
| Immigrants | Bosnia and Herzegovina | 15.6 /100 | #206 | Poor $38,886 |
| Immigrants | Cambodia | 14.2 /100 | #207 | Poor $38,833 |
| Immigrants | Thailand | 13.6 /100 | #208 | Poor $38,810 |
| Norwegians | 13.4 /100 | #209 | Poor $38,802 |
| Czechoslovakians | 12.0 /100 | #210 | Poor $38,738 |
| Aleuts | 11.6 /100 | #211 | Poor $38,719 |
| Guamanians/Chamorros | 11.5 /100 | #212 | Poor $38,717 |
| Jamaicans | 10.5 /100 | #213 | Poor $38,670 |
| Iraqis | 10.5 /100 | #214 | Poor $38,666 |
| Spaniards | 10.3 /100 | #215 | Poor $38,656 |
| Immigrants | Ecuador | 10.1 /100 | #216 | Poor $38,644 |
| Immigrants | Jamaica | 9.7 /100 | #217 | Tragic $38,625 |
| Cape Verdeans | 9.5 /100 | #218 | Tragic $38,614 |
| Nepalese | 9.3 /100 | #219 | Tragic $38,603 |