Trinidadian and Tobagonian vs Guamanian/Chamorro Single Father Households
COMPARE
Trinidadian and Tobagonian
Guamanian/Chamorro
Single Father Households
Single Father Households Comparison
Trinidadians and Tobagonians
Guamanians/Chamorros
2.2%
SINGLE FATHER HOUSEHOLDS
97.8/ 100
METRIC RATING
119th/ 347
METRIC RANK
2.6%
SINGLE FATHER HOUSEHOLDS
0.4/ 100
METRIC RATING
267th/ 347
METRIC RANK
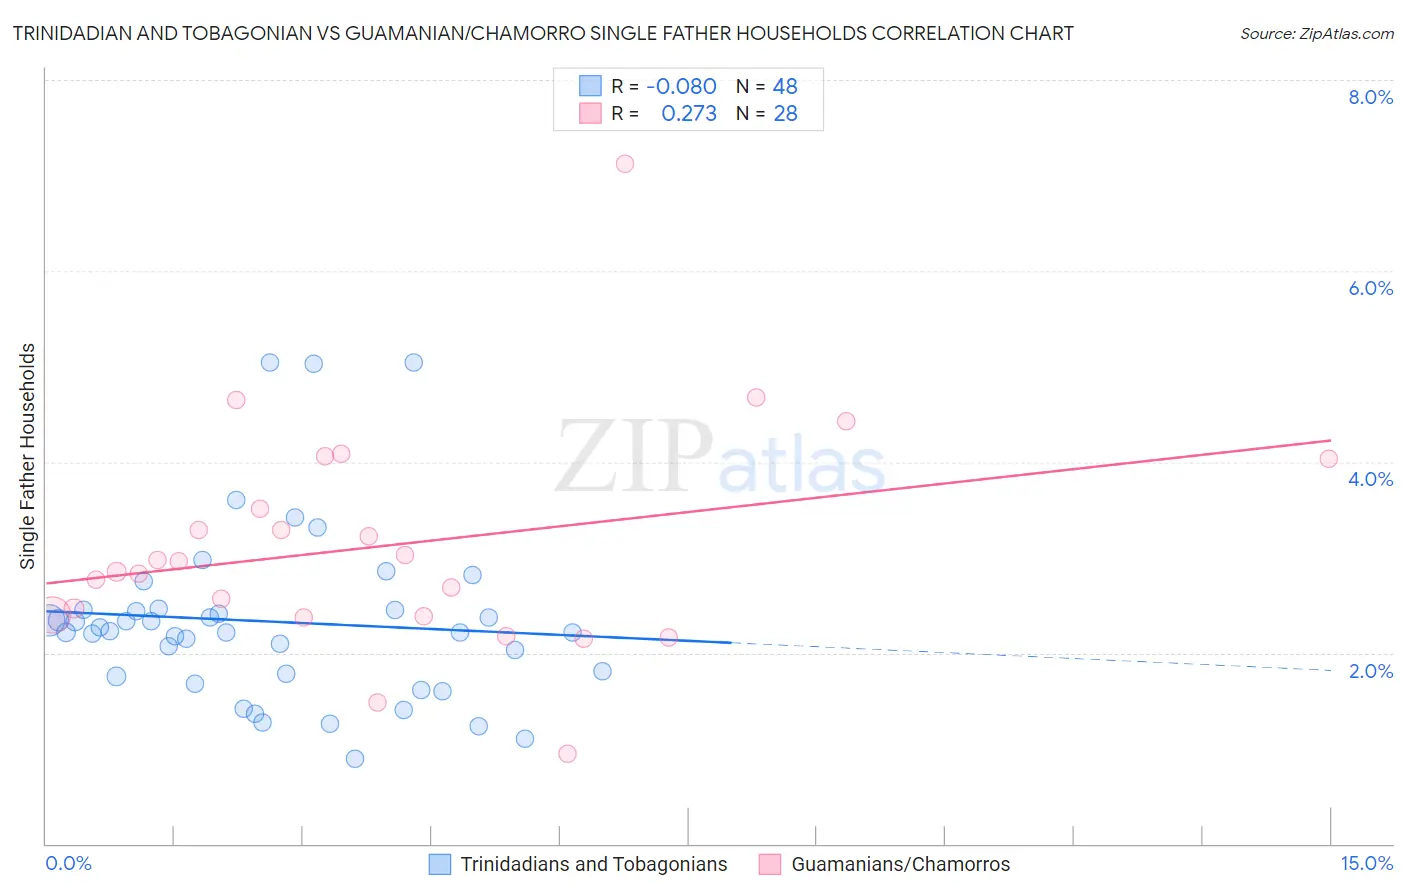
Trinidadian and Tobagonian vs Guamanian/Chamorro Single Father Households Correlation Chart
The statistical analysis conducted on geographies consisting of 218,763,381 people shows a slight negative correlation between the proportion of Trinidadians and Tobagonians and percentage of single father households in the United States with a correlation coefficient (R) of -0.080 and weighted average of 2.2%. Similarly, the statistical analysis conducted on geographies consisting of 221,076,746 people shows a weak positive correlation between the proportion of Guamanians/Chamorros and percentage of single father households in the United States with a correlation coefficient (R) of 0.273 and weighted average of 2.6%, a difference of 18.6%.
Single Father Households Correlation Summary
| Measurement | Trinidadian and Tobagonian | Guamanian/Chamorro |
| Minimum | 0.89% | 0.94% |
| Maximum | 5.0% | 7.1% |
| Range | 4.2% | 6.2% |
| Mean | 2.3% | 3.1% |
| Median | 2.2% | 2.9% |
| Interquartile 25% (IQ1) | 1.8% | 2.4% |
| Interquartile 75% (IQ3) | 2.5% | 3.8% |
| Interquartile Range (IQR) | 0.69% | 1.4% |
| Standard Deviation (Sample) | 0.92% | 1.2% |
| Standard Deviation (Population) | 0.91% | 1.2% |
Similar Demographics by Single Father Households
Demographics Similar to Trinidadians and Tobagonians by Single Father Households
In terms of single father households, the demographic groups most similar to Trinidadians and Tobagonians are Australian (2.2%, a difference of 0.030%), Immigrants from Brazil (2.2%, a difference of 0.040%), Immigrants from Morocco (2.2%, a difference of 0.060%), Immigrants from Iraq (2.2%, a difference of 0.13%), and Hungarian (2.2%, a difference of 0.16%).
| Demographics | Rating | Rank | Single Father Households |
| Immigrants | Trinidad and Tobago | 98.2 /100 | #112 | Exceptional 2.2% |
| Iraqis | 98.2 /100 | #113 | Exceptional 2.2% |
| Immigrants | North America | 98.2 /100 | #114 | Exceptional 2.2% |
| Immigrants | Barbados | 98.2 /100 | #115 | Exceptional 2.2% |
| Immigrants | Argentina | 98.1 /100 | #116 | Exceptional 2.2% |
| Hungarians | 97.9 /100 | #117 | Exceptional 2.2% |
| Immigrants | Morocco | 97.8 /100 | #118 | Exceptional 2.2% |
| Trinidadians and Tobagonians | 97.8 /100 | #119 | Exceptional 2.2% |
| Australians | 97.7 /100 | #120 | Exceptional 2.2% |
| Immigrants | Brazil | 97.7 /100 | #121 | Exceptional 2.2% |
| Immigrants | Iraq | 97.6 /100 | #122 | Exceptional 2.2% |
| Immigrants | Yemen | 97.5 /100 | #123 | Exceptional 2.2% |
| British West Indians | 97.4 /100 | #124 | Exceptional 2.2% |
| Immigrants | Indonesia | 97.4 /100 | #125 | Exceptional 2.2% |
| Moroccans | 96.9 /100 | #126 | Exceptional 2.2% |
Demographics Similar to Guamanians/Chamorros by Single Father Households
In terms of single father households, the demographic groups most similar to Guamanians/Chamorros are Haitian (2.6%, a difference of 0.040%), Cuban (2.6%, a difference of 0.38%), French American Indian (2.6%, a difference of 0.48%), Immigrants from Micronesia (2.6%, a difference of 0.52%), and Seminole (2.6%, a difference of 0.52%).
| Demographics | Rating | Rank | Single Father Households |
| Immigrants | Caribbean | 1.0 /100 | #260 | Tragic 2.5% |
| Immigrants | Belize | 0.9 /100 | #261 | Tragic 2.5% |
| Immigrants | Liberia | 0.8 /100 | #262 | Tragic 2.5% |
| Dominicans | 0.8 /100 | #263 | Tragic 2.5% |
| Indonesians | 0.5 /100 | #264 | Tragic 2.6% |
| Immigrants | Micronesia | 0.5 /100 | #265 | Tragic 2.6% |
| French American Indians | 0.5 /100 | #266 | Tragic 2.6% |
| Guamanians/Chamorros | 0.4 /100 | #267 | Tragic 2.6% |
| Haitians | 0.4 /100 | #268 | Tragic 2.6% |
| Cubans | 0.3 /100 | #269 | Tragic 2.6% |
| Seminole | 0.3 /100 | #270 | Tragic 2.6% |
| Creek | 0.2 /100 | #271 | Tragic 2.6% |
| Belizeans | 0.2 /100 | #272 | Tragic 2.6% |
| Iroquois | 0.2 /100 | #273 | Tragic 2.6% |
| Puerto Ricans | 0.2 /100 | #274 | Tragic 2.6% |