Trinidadian and Tobagonian vs Guamanian/Chamorro 9th Grade
COMPARE
Trinidadian and Tobagonian
Guamanian/Chamorro
9th Grade
9th Grade Comparison
Trinidadians and Tobagonians
Guamanians/Chamorros
93.7%
9TH GRADE
0.1/ 100
METRIC RATING
279th/ 347
METRIC RANK
94.8%
9TH GRADE
35.5/ 100
METRIC RATING
187th/ 347
METRIC RANK
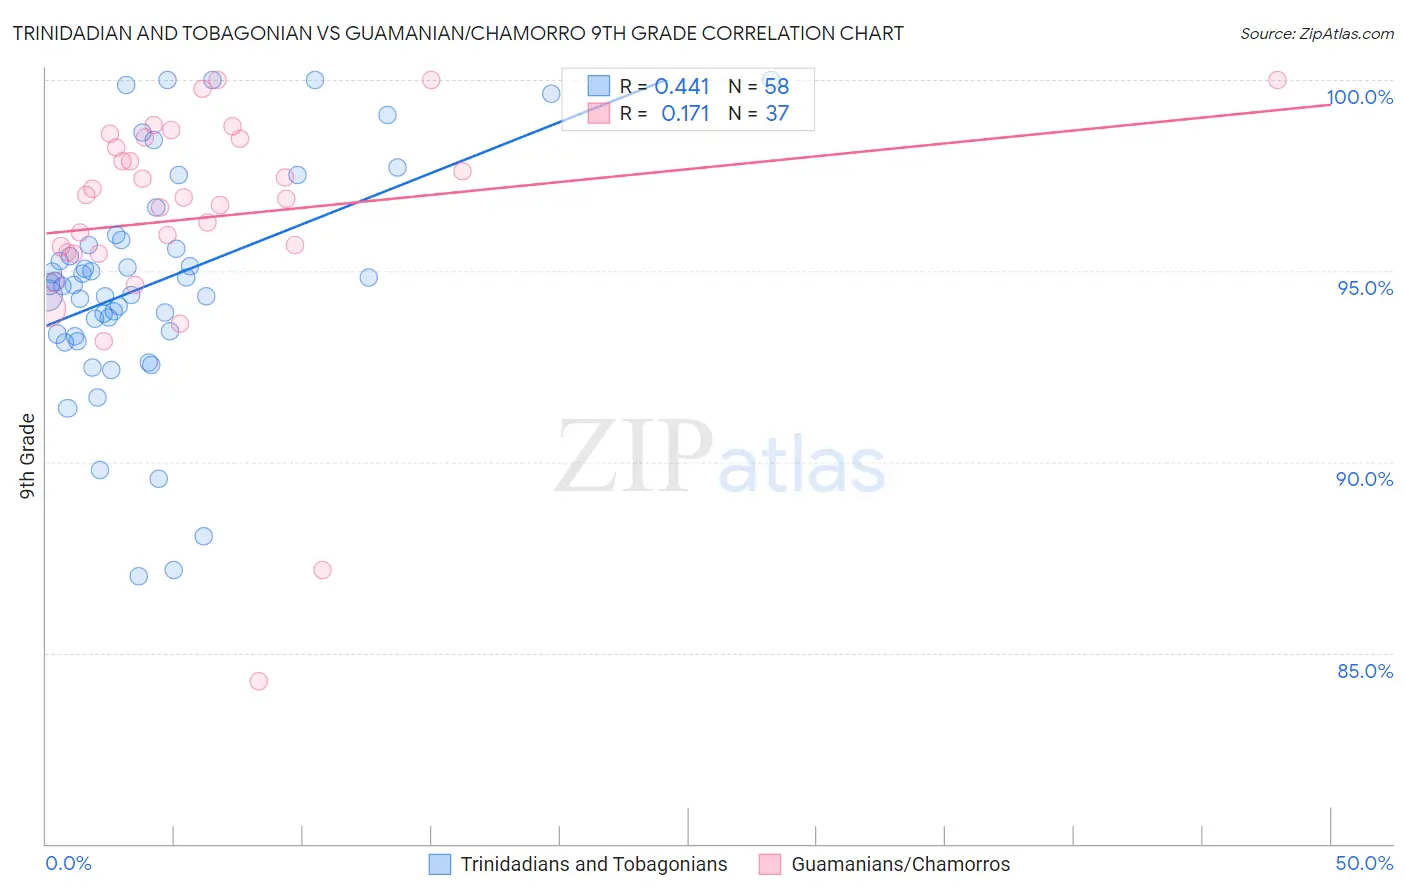
Trinidadian and Tobagonian vs Guamanian/Chamorro 9th Grade Correlation Chart
The statistical analysis conducted on geographies consisting of 219,881,170 people shows a moderate positive correlation between the proportion of Trinidadians and Tobagonians and percentage of population with at least 9th grade education in the United States with a correlation coefficient (R) of 0.441 and weighted average of 93.7%. Similarly, the statistical analysis conducted on geographies consisting of 221,965,618 people shows a poor positive correlation between the proportion of Guamanians/Chamorros and percentage of population with at least 9th grade education in the United States with a correlation coefficient (R) of 0.171 and weighted average of 94.8%, a difference of 1.2%.
9th Grade Correlation Summary
| Measurement | Trinidadian and Tobagonian | Guamanian/Chamorro |
| Minimum | 87.0% | 84.3% |
| Maximum | 100.0% | 100.0% |
| Range | 13.0% | 15.7% |
| Mean | 94.7% | 96.4% |
| Median | 94.6% | 96.9% |
| Interquartile 25% (IQ1) | 93.3% | 95.5% |
| Interquartile 75% (IQ3) | 95.8% | 98.5% |
| Interquartile Range (IQR) | 2.5% | 3.0% |
| Standard Deviation (Sample) | 3.0% | 3.2% |
| Standard Deviation (Population) | 3.0% | 3.1% |
Similar Demographics by 9th Grade
Demographics Similar to Trinidadians and Tobagonians by 9th Grade
In terms of 9th grade, the demographic groups most similar to Trinidadians and Tobagonians are Immigrants from Philippines (93.7%, a difference of 0.060%), Immigrants from Eritrea (93.7%, a difference of 0.060%), West Indian (93.7%, a difference of 0.070%), Immigrants from Colombia (93.8%, a difference of 0.080%), and Taiwanese (93.6%, a difference of 0.080%).
| Demographics | Rating | Rank | 9th Grade |
| Immigrants | Western Africa | 0.2 /100 | #272 | Tragic 93.8% |
| Immigrants | South America | 0.2 /100 | #273 | Tragic 93.8% |
| Peruvians | 0.2 /100 | #274 | Tragic 93.8% |
| Immigrants | Colombia | 0.2 /100 | #275 | Tragic 93.8% |
| West Indians | 0.2 /100 | #276 | Tragic 93.7% |
| Immigrants | Philippines | 0.1 /100 | #277 | Tragic 93.7% |
| Immigrants | Eritrea | 0.1 /100 | #278 | Tragic 93.7% |
| Trinidadians and Tobagonians | 0.1 /100 | #279 | Tragic 93.7% |
| Taiwanese | 0.1 /100 | #280 | Tragic 93.6% |
| Immigrants | Trinidad and Tobago | 0.1 /100 | #281 | Tragic 93.6% |
| Malaysians | 0.0 /100 | #282 | Tragic 93.5% |
| Barbadians | 0.0 /100 | #283 | Tragic 93.5% |
| Bangladeshis | 0.0 /100 | #284 | Tragic 93.4% |
| Immigrants | Peru | 0.0 /100 | #285 | Tragic 93.4% |
| Immigrants | Barbados | 0.0 /100 | #286 | Tragic 93.4% |
Demographics Similar to Guamanians/Chamorros by 9th Grade
In terms of 9th grade, the demographic groups most similar to Guamanians/Chamorros are Hopi (94.8%, a difference of 0.010%), Immigrants from Albania (94.8%, a difference of 0.010%), Immigrants from Argentina (94.8%, a difference of 0.010%), Argentinean (94.8%, a difference of 0.020%), and Liberian (94.8%, a difference of 0.020%).
| Demographics | Rating | Rank | 9th Grade |
| Immigrants | Uganda | 43.1 /100 | #180 | Average 94.8% |
| Sierra Leoneans | 42.7 /100 | #181 | Average 94.8% |
| Seminole | 42.5 /100 | #182 | Average 94.8% |
| Immigrants | Nepal | 39.7 /100 | #183 | Fair 94.8% |
| Argentineans | 37.6 /100 | #184 | Fair 94.8% |
| Liberians | 37.4 /100 | #185 | Fair 94.8% |
| Hopi | 37.1 /100 | #186 | Fair 94.8% |
| Guamanians/Chamorros | 35.5 /100 | #187 | Fair 94.8% |
| Immigrants | Albania | 34.5 /100 | #188 | Fair 94.8% |
| Immigrants | Argentina | 34.4 /100 | #189 | Fair 94.8% |
| Sudanese | 32.7 /100 | #190 | Fair 94.7% |
| Assyrians/Chaldeans/Syriacs | 32.0 /100 | #191 | Fair 94.7% |
| Immigrants | Northern Africa | 30.7 /100 | #192 | Fair 94.7% |
| Paraguayans | 30.1 /100 | #193 | Fair 94.7% |
| Panamanians | 29.0 /100 | #194 | Fair 94.7% |