Immigrants from North Macedonia vs Guamanian/Chamorro Median Female Earnings
COMPARE
Immigrants from North Macedonia
Guamanian/Chamorro
Median Female Earnings
Median Female Earnings Comparison
Immigrants from North Macedonia
Guamanians/Chamorros
$40,488
MEDIAN FEMALE EARNINGS
83.8/ 100
METRIC RATING
144th/ 347
METRIC RANK
$38,717
MEDIAN FEMALE EARNINGS
11.5/ 100
METRIC RATING
212th/ 347
METRIC RANK
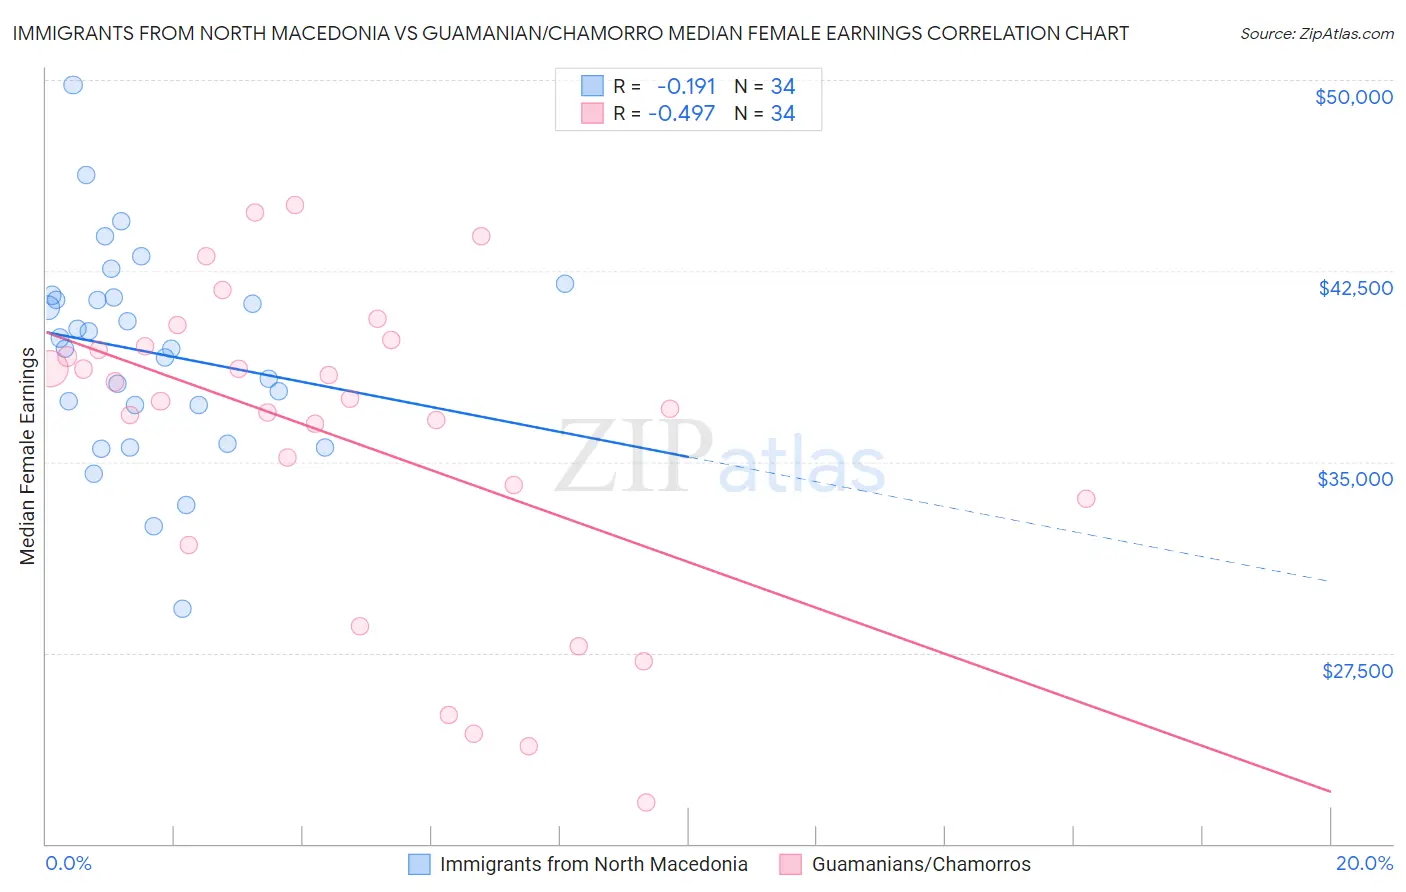
Immigrants from North Macedonia vs Guamanian/Chamorro Median Female Earnings Correlation Chart
The statistical analysis conducted on geographies consisting of 74,042,106 people shows a poor negative correlation between the proportion of Immigrants from North Macedonia and median female earnings in the United States with a correlation coefficient (R) of -0.191 and weighted average of $40,488. Similarly, the statistical analysis conducted on geographies consisting of 221,909,570 people shows a moderate negative correlation between the proportion of Guamanians/Chamorros and median female earnings in the United States with a correlation coefficient (R) of -0.497 and weighted average of $38,717, a difference of 4.6%.
Median Female Earnings Correlation Summary
| Measurement | Immigrants from North Macedonia | Guamanian/Chamorro |
| Minimum | $29,254 | $21,607 |
| Maximum | $49,827 | $45,111 |
| Range | $20,573 | $23,504 |
| Mean | $39,315 | $35,932 |
| Median | $39,666 | $37,420 |
| Interquartile 25% (IQ1) | $37,214 | $33,542 |
| Interquartile 75% (IQ3) | $41,437 | $39,523 |
| Interquartile Range (IQR) | $4,223 | $5,981 |
| Standard Deviation (Sample) | $4,067 | $6,215 |
| Standard Deviation (Population) | $4,007 | $6,122 |
Similar Demographics by Median Female Earnings
Demographics Similar to Immigrants from North Macedonia by Median Female Earnings
In terms of median female earnings, the demographic groups most similar to Immigrants from North Macedonia are Northern European ($40,491, a difference of 0.010%), Brazilian ($40,483, a difference of 0.010%), Sri Lankan ($40,496, a difference of 0.020%), Immigrants from Syria ($40,499, a difference of 0.030%), and Serbian ($40,539, a difference of 0.12%).
| Demographics | Rating | Rank | Median Female Earnings |
| Pakistanis | 86.6 /100 | #137 | Excellent $40,596 |
| Taiwanese | 86.1 /100 | #138 | Excellent $40,576 |
| Immigrants | South Eastern Asia | 85.7 /100 | #139 | Excellent $40,558 |
| Serbians | 85.2 /100 | #140 | Excellent $40,539 |
| Immigrants | Syria | 84.1 /100 | #141 | Excellent $40,499 |
| Sri Lankans | 84.0 /100 | #142 | Excellent $40,496 |
| Northern Europeans | 83.9 /100 | #143 | Excellent $40,491 |
| Immigrants | North Macedonia | 83.8 /100 | #144 | Excellent $40,488 |
| Brazilians | 83.6 /100 | #145 | Excellent $40,483 |
| Ghanaians | 82.1 /100 | #146 | Excellent $40,429 |
| Vietnamese | 80.4 /100 | #147 | Excellent $40,377 |
| Poles | 80.2 /100 | #148 | Excellent $40,371 |
| Immigrants | Cameroon | 79.7 /100 | #149 | Good $40,354 |
| Immigrants | Chile | 79.6 /100 | #150 | Good $40,353 |
| Immigrants | Armenia | 79.2 /100 | #151 | Good $40,340 |
Demographics Similar to Guamanians/Chamorros by Median Female Earnings
In terms of median female earnings, the demographic groups most similar to Guamanians/Chamorros are Aleut ($38,719, a difference of 0.010%), Czechoslovakian ($38,738, a difference of 0.050%), Jamaican ($38,670, a difference of 0.12%), Iraqi ($38,666, a difference of 0.13%), and Spaniard ($38,656, a difference of 0.16%).
| Demographics | Rating | Rank | Median Female Earnings |
| Immigrants | Colombia | 16.3 /100 | #205 | Poor $38,913 |
| Immigrants | Bosnia and Herzegovina | 15.6 /100 | #206 | Poor $38,886 |
| Immigrants | Cambodia | 14.2 /100 | #207 | Poor $38,833 |
| Immigrants | Thailand | 13.6 /100 | #208 | Poor $38,810 |
| Norwegians | 13.4 /100 | #209 | Poor $38,802 |
| Czechoslovakians | 12.0 /100 | #210 | Poor $38,738 |
| Aleuts | 11.6 /100 | #211 | Poor $38,719 |
| Guamanians/Chamorros | 11.5 /100 | #212 | Poor $38,717 |
| Jamaicans | 10.5 /100 | #213 | Poor $38,670 |
| Iraqis | 10.5 /100 | #214 | Poor $38,666 |
| Spaniards | 10.3 /100 | #215 | Poor $38,656 |
| Immigrants | Ecuador | 10.1 /100 | #216 | Poor $38,644 |
| Immigrants | Jamaica | 9.7 /100 | #217 | Tragic $38,625 |
| Cape Verdeans | 9.5 /100 | #218 | Tragic $38,614 |
| Nepalese | 9.3 /100 | #219 | Tragic $38,603 |