Immigrants from Dominican Republic vs Welsh Householder Income Under 25 years
COMPARE
Immigrants from Dominican Republic
Welsh
Householder Income Under 25 years
Householder Income Under 25 years Comparison
Immigrants from Dominican Republic
Welsh
$50,204
HOUSEHOLDER INCOME UNDER 25 YEARS
0.8/ 100
METRIC RATING
263rd/ 347
METRIC RANK
$50,597
HOUSEHOLDER INCOME UNDER 25 YEARS
2.0/ 100
METRIC RATING
246th/ 347
METRIC RANK
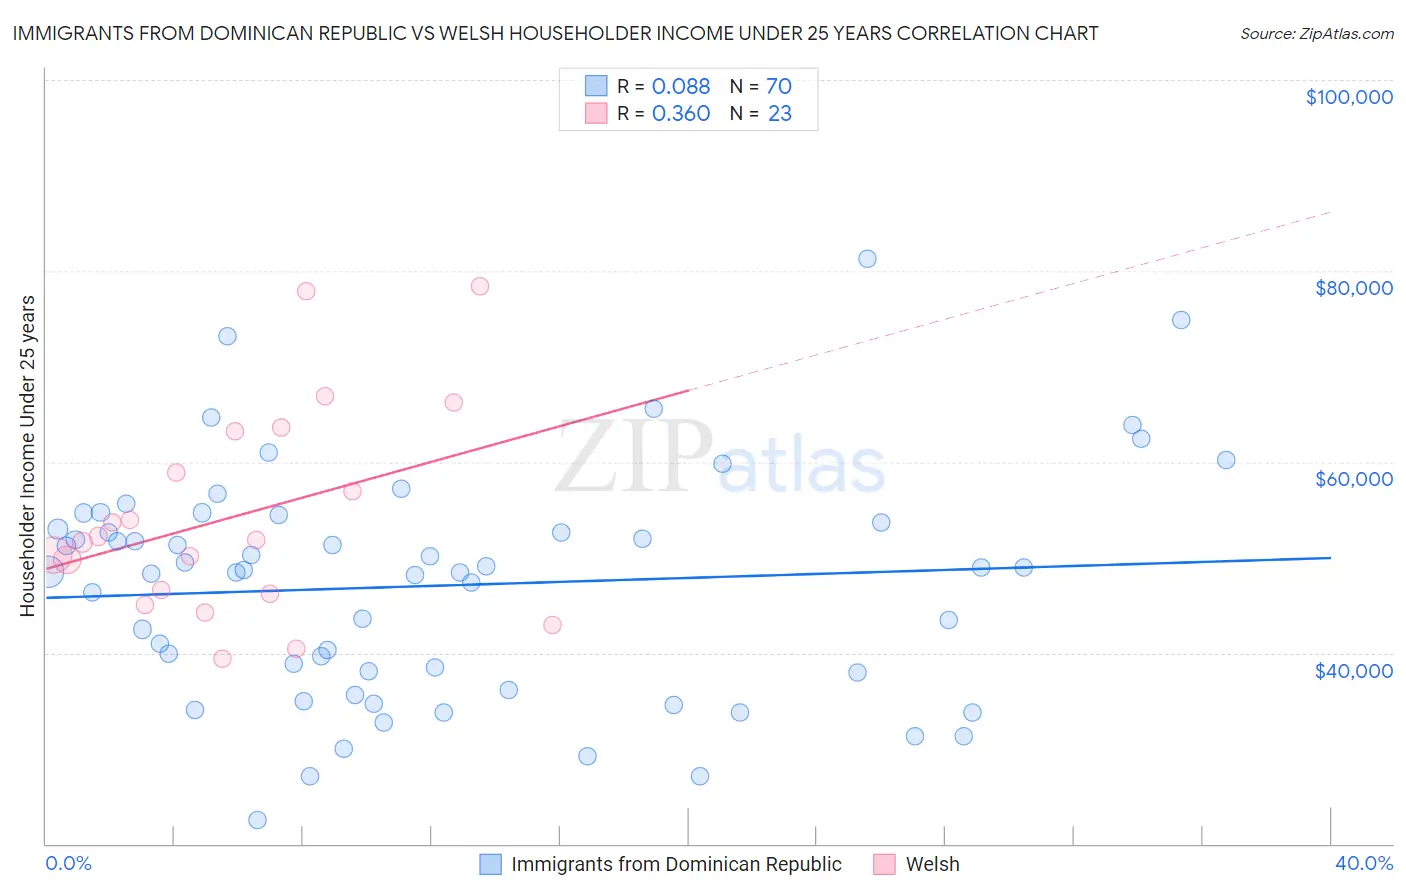
Immigrants from Dominican Republic vs Welsh Householder Income Under 25 years Correlation Chart
The statistical analysis conducted on geographies consisting of 234,366,360 people shows a slight positive correlation between the proportion of Immigrants from Dominican Republic and household income with householder under the age of 25 in the United States with a correlation coefficient (R) of 0.088 and weighted average of $50,204. Similarly, the statistical analysis conducted on geographies consisting of 418,128,856 people shows a mild positive correlation between the proportion of Welsh and household income with householder under the age of 25 in the United States with a correlation coefficient (R) of 0.360 and weighted average of $50,597, a difference of 0.78%.
Householder Income Under 25 years Correlation Summary
| Measurement | Immigrants from Dominican Republic | Welsh |
| Minimum | $22,546 | $39,341 |
| Maximum | $81,320 | $78,342 |
| Range | $58,774 | $39,001 |
| Mean | $47,058 | $54,354 |
| Median | $48,612 | $51,818 |
| Interquartile 25% (IQ1) | $37,938 | $46,242 |
| Interquartile 75% (IQ3) | $53,715 | $63,259 |
| Interquartile Range (IQR) | $15,777 | $17,017 |
| Standard Deviation (Sample) | $11,939 | $10,784 |
| Standard Deviation (Population) | $11,853 | $10,547 |
Demographics Similar to Immigrants from Dominican Republic and Welsh by Householder Income Under 25 years
In terms of householder income under 25 years, the demographic groups most similar to Immigrants from Dominican Republic are Haitian ($50,231, a difference of 0.050%), Hungarian ($50,247, a difference of 0.090%), Fijian ($50,132, a difference of 0.14%), Hispanic or Latino ($50,279, a difference of 0.15%), and Immigrants from Dominica ($50,301, a difference of 0.19%). Similarly, the demographic groups most similar to Welsh are Immigrants from Africa ($50,609, a difference of 0.020%), Marshallese ($50,627, a difference of 0.060%), Immigrants from Bosnia and Herzegovina ($50,565, a difference of 0.060%), Slavic ($50,563, a difference of 0.070%), and Scottish ($50,554, a difference of 0.090%).
| Demographics | Rating | Rank | Householder Income Under 25 years |
| Marshallese | 2.1 /100 | #244 | Tragic $50,627 |
| Immigrants | Africa | 2.0 /100 | #245 | Tragic $50,609 |
| Welsh | 2.0 /100 | #246 | Tragic $50,597 |
| Immigrants | Bosnia and Herzegovina | 1.8 /100 | #247 | Tragic $50,565 |
| Slavs | 1.8 /100 | #248 | Tragic $50,563 |
| Scottish | 1.8 /100 | #249 | Tragic $50,554 |
| Immigrants | Cabo Verde | 1.7 /100 | #250 | Tragic $50,520 |
| Celtics | 1.4 /100 | #251 | Tragic $50,447 |
| Immigrants | Mexico | 1.3 /100 | #252 | Tragic $50,422 |
| Immigrants | Haiti | 1.2 /100 | #253 | Tragic $50,398 |
| Luxembourgers | 1.2 /100 | #254 | Tragic $50,379 |
| Aleuts | 1.2 /100 | #255 | Tragic $50,377 |
| Immigrants | Cuba | 1.2 /100 | #256 | Tragic $50,374 |
| Lebanese | 1.1 /100 | #257 | Tragic $50,355 |
| Whites/Caucasians | 1.1 /100 | #258 | Tragic $50,336 |
| Immigrants | Dominica | 1.0 /100 | #259 | Tragic $50,301 |
| Hispanics or Latinos | 0.9 /100 | #260 | Tragic $50,279 |
| Hungarians | 0.9 /100 | #261 | Tragic $50,247 |
| Haitians | 0.8 /100 | #262 | Tragic $50,231 |
| Immigrants | Dominican Republic | 0.8 /100 | #263 | Tragic $50,204 |
| Fijians | 0.6 /100 | #264 | Tragic $50,132 |