Immigrants from Scotland vs Nepalese Householder Income Over 65 years
COMPARE
Immigrants from Scotland
Nepalese
Householder Income Over 65 years
Householder Income Over 65 years Comparison
Immigrants from Scotland
Nepalese
$66,620
HOUSEHOLDER INCOME OVER 65 YEARS
99.7/ 100
METRIC RATING
52nd/ 347
METRIC RANK
$58,761
HOUSEHOLDER INCOME OVER 65 YEARS
9.0/ 100
METRIC RATING
214th/ 347
METRIC RANK
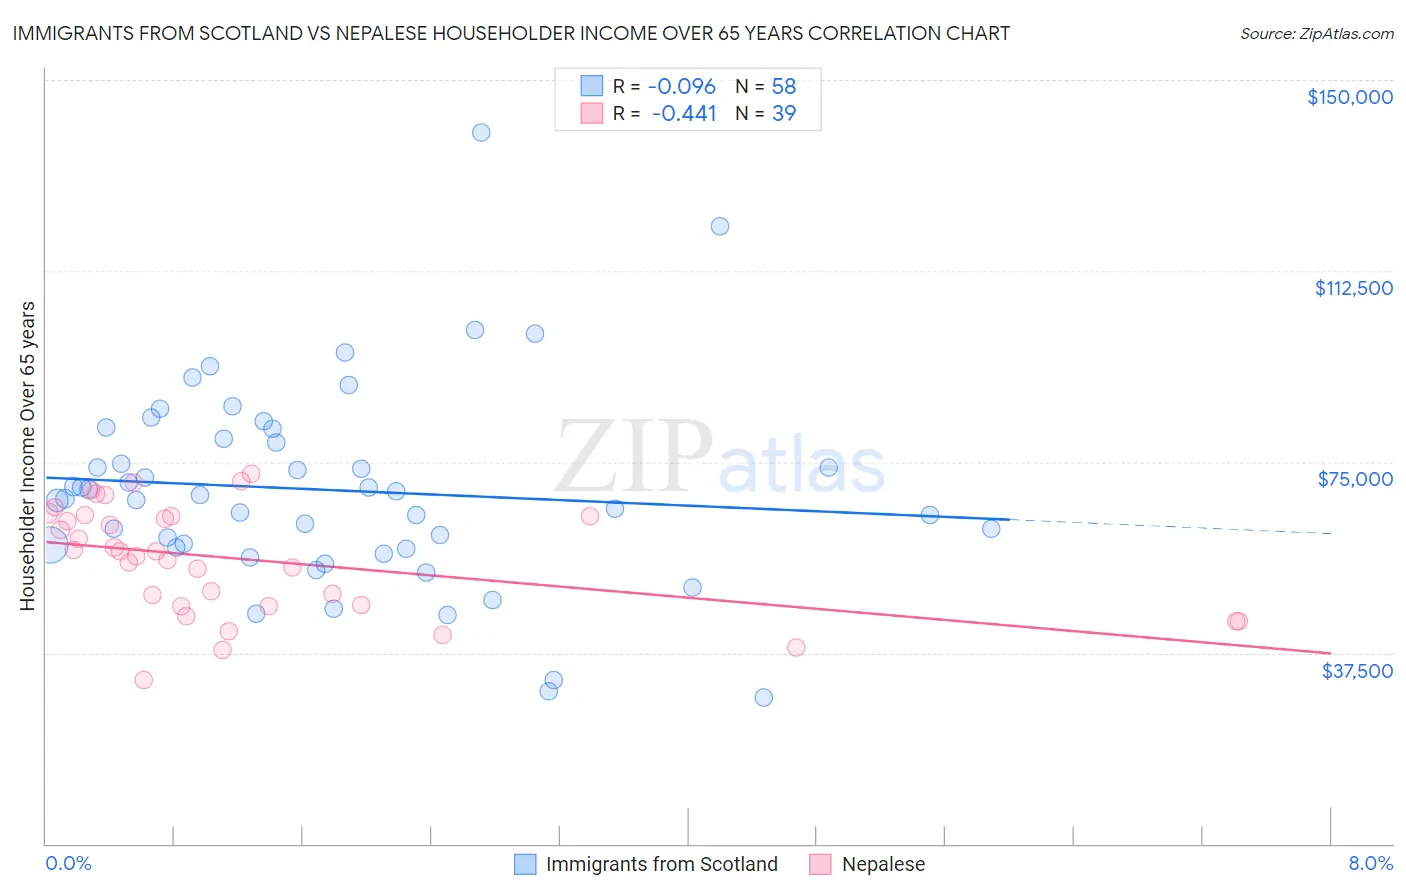
Immigrants from Scotland vs Nepalese Householder Income Over 65 years Correlation Chart
The statistical analysis conducted on geographies consisting of 196,236,719 people shows a slight negative correlation between the proportion of Immigrants from Scotland and household income with householder over the age of 65 in the United States with a correlation coefficient (R) of -0.096 and weighted average of $66,620. Similarly, the statistical analysis conducted on geographies consisting of 24,501,136 people shows a moderate negative correlation between the proportion of Nepalese and household income with householder over the age of 65 in the United States with a correlation coefficient (R) of -0.441 and weighted average of $58,761, a difference of 13.4%.
Householder Income Over 65 years Correlation Summary
| Measurement | Immigrants from Scotland | Nepalese |
| Minimum | $28,672 | $32,174 |
| Maximum | $139,643 | $72,725 |
| Range | $110,971 | $40,551 |
| Mean | $69,451 | $55,785 |
| Median | $68,138 | $57,344 |
| Interquartile 25% (IQ1) | $58,075 | $46,756 |
| Interquartile 75% (IQ3) | $79,459 | $64,405 |
| Interquartile Range (IQR) | $21,384 | $17,649 |
| Standard Deviation (Sample) | $19,829 | $10,626 |
| Standard Deviation (Population) | $19,657 | $10,489 |
Similar Demographics by Householder Income Over 65 years
Demographics Similar to Immigrants from Scotland by Householder Income Over 65 years
In terms of householder income over 65 years, the demographic groups most similar to Immigrants from Scotland are Immigrants from Pakistan ($66,617, a difference of 0.0%), Israeli ($66,636, a difference of 0.020%), Immigrants from Turkey ($66,672, a difference of 0.080%), Immigrants from Indonesia ($66,694, a difference of 0.11%), and Immigrants from Netherlands ($66,463, a difference of 0.24%).
| Demographics | Rating | Rank | Householder Income Over 65 years |
| Immigrants | Afghanistan | 99.8 /100 | #45 | Exceptional $67,007 |
| Cambodians | 99.8 /100 | #46 | Exceptional $66,892 |
| Australians | 99.8 /100 | #47 | Exceptional $66,891 |
| Immigrants | France | 99.8 /100 | #48 | Exceptional $66,826 |
| Immigrants | Indonesia | 99.8 /100 | #49 | Exceptional $66,694 |
| Immigrants | Turkey | 99.7 /100 | #50 | Exceptional $66,672 |
| Israelis | 99.7 /100 | #51 | Exceptional $66,636 |
| Immigrants | Scotland | 99.7 /100 | #52 | Exceptional $66,620 |
| Immigrants | Pakistan | 99.7 /100 | #53 | Exceptional $66,617 |
| Immigrants | Netherlands | 99.7 /100 | #54 | Exceptional $66,463 |
| Immigrants | Czechoslovakia | 99.7 /100 | #55 | Exceptional $66,376 |
| Laotians | 99.6 /100 | #56 | Exceptional $66,306 |
| Bulgarians | 99.6 /100 | #57 | Exceptional $66,236 |
| Immigrants | Philippines | 99.6 /100 | #58 | Exceptional $66,161 |
| Immigrants | Norway | 99.5 /100 | #59 | Exceptional $66,118 |
Demographics Similar to Nepalese by Householder Income Over 65 years
In terms of householder income over 65 years, the demographic groups most similar to Nepalese are Colombian ($58,851, a difference of 0.15%), White/Caucasian ($58,847, a difference of 0.15%), Immigrants from Ghana ($58,624, a difference of 0.23%), Immigrants from Nigeria ($58,942, a difference of 0.31%), and Nigerian ($58,992, a difference of 0.39%).
| Demographics | Rating | Rank | Householder Income Over 65 years |
| Salvadorans | 12.9 /100 | #207 | Poor $59,141 |
| Uruguayans | 12.3 /100 | #208 | Poor $59,090 |
| Slovaks | 11.7 /100 | #209 | Poor $59,039 |
| Nigerians | 11.2 /100 | #210 | Poor $58,992 |
| Immigrants | Nigeria | 10.7 /100 | #211 | Poor $58,942 |
| Colombians | 9.8 /100 | #212 | Tragic $58,851 |
| Whites/Caucasians | 9.8 /100 | #213 | Tragic $58,847 |
| Nepalese | 9.0 /100 | #214 | Tragic $58,761 |
| Immigrants | Ghana | 7.9 /100 | #215 | Tragic $58,624 |
| Immigrants | Middle Africa | 6.2 /100 | #216 | Tragic $58,375 |
| Sudanese | 5.7 /100 | #217 | Tragic $58,281 |
| Panamanians | 5.6 /100 | #218 | Tragic $58,266 |
| Malaysians | 5.5 /100 | #219 | Tragic $58,244 |
| Yugoslavians | 5.5 /100 | #220 | Tragic $58,243 |
| Immigrants | El Salvador | 5.4 /100 | #221 | Tragic $58,226 |