Tohono O'odham vs Nepalese No Schooling Completed
COMPARE
Tohono O'odham
Nepalese
No Schooling Completed
No Schooling Completed Comparison
Tohono O'odham
Nepalese
2.3%
NO SCHOOLING COMPLETED
4.1/ 100
METRIC RATING
224th/ 347
METRIC RANK
3.8%
NO SCHOOLING COMPLETED
0.0/ 100
METRIC RATING
344th/ 347
METRIC RANK
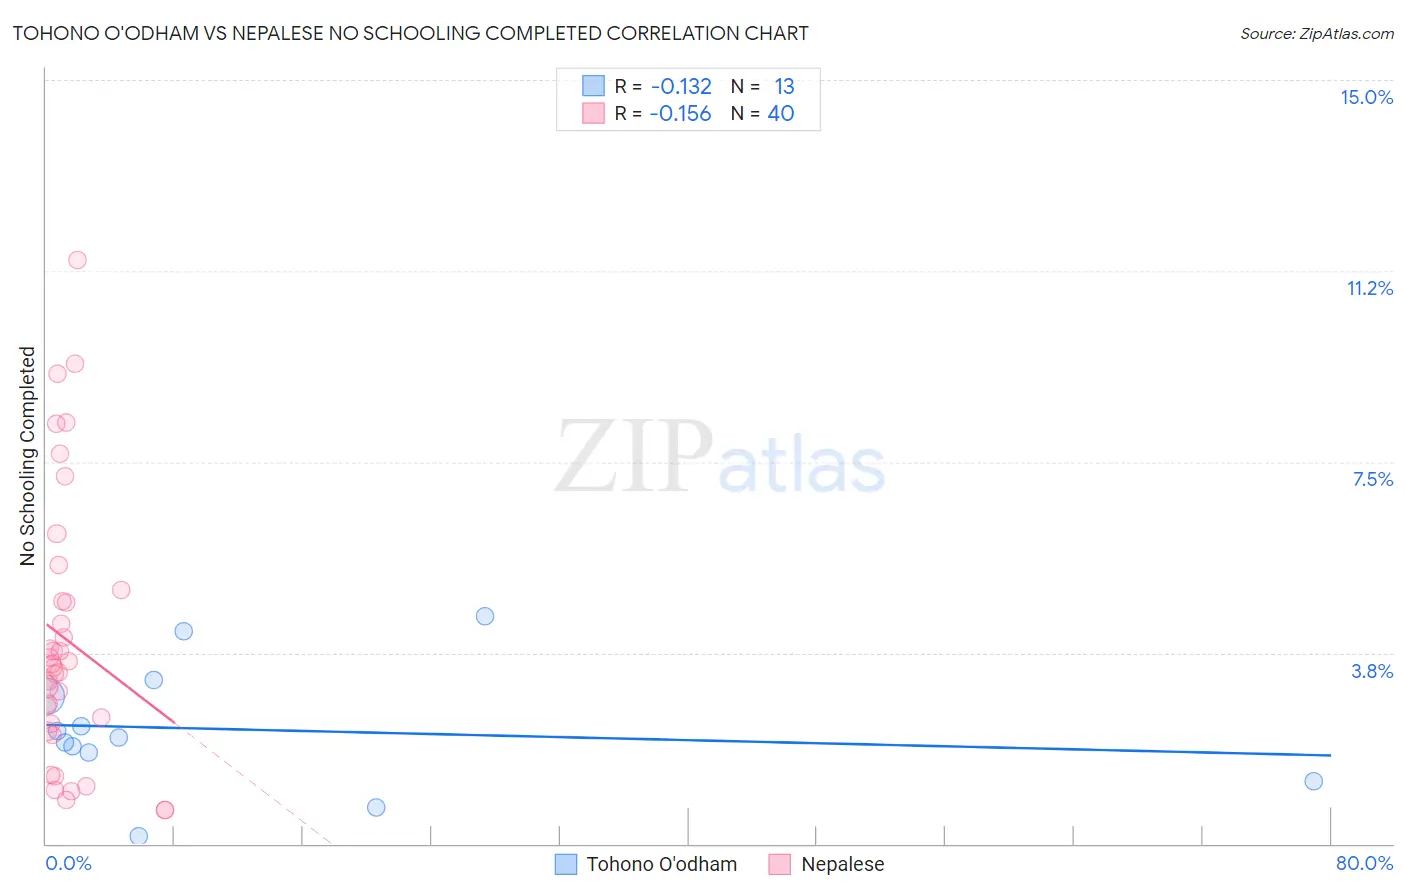
Tohono O'odham vs Nepalese No Schooling Completed Correlation Chart
The statistical analysis conducted on geographies consisting of 58,626,316 people shows a poor negative correlation between the proportion of Tohono O'odham and percentage of population with no schooling in the United States with a correlation coefficient (R) of -0.132 and weighted average of 2.3%. Similarly, the statistical analysis conducted on geographies consisting of 24,510,165 people shows a poor negative correlation between the proportion of Nepalese and percentage of population with no schooling in the United States with a correlation coefficient (R) of -0.156 and weighted average of 3.8%, a difference of 64.7%.
No Schooling Completed Correlation Summary
| Measurement | Tohono O'odham | Nepalese |
| Minimum | 0.14% | 0.66% |
| Maximum | 4.5% | 11.5% |
| Range | 4.3% | 10.8% |
| Mean | 2.2% | 4.0% |
| Median | 2.1% | 3.5% |
| Interquartile 25% (IQ1) | 1.5% | 2.3% |
| Interquartile 75% (IQ3) | 3.1% | 4.9% |
| Interquartile Range (IQR) | 1.5% | 2.6% |
| Standard Deviation (Sample) | 1.2% | 2.6% |
| Standard Deviation (Population) | 1.2% | 2.6% |
Similar Demographics by No Schooling Completed
Demographics Similar to Tohono O'odham by No Schooling Completed
In terms of no schooling completed, the demographic groups most similar to Tohono O'odham are Sudanese (2.3%, a difference of 0.0%), Sierra Leonean (2.3%, a difference of 0.020%), Immigrants from Uganda (2.3%, a difference of 0.070%), Immigrants from Lebanon (2.3%, a difference of 0.29%), and U.S. Virgin Islander (2.3%, a difference of 0.36%).
| Demographics | Rating | Rank | No Schooling Completed |
| Immigrants | Syria | 6.6 /100 | #217 | Tragic 2.3% |
| Immigrants | Nepal | 6.4 /100 | #218 | Tragic 2.3% |
| Senegalese | 5.6 /100 | #219 | Tragic 2.3% |
| Immigrants | Costa Rica | 5.1 /100 | #220 | Tragic 2.3% |
| Immigrants | Sudan | 5.0 /100 | #221 | Tragic 2.3% |
| Sub-Saharan Africans | 4.7 /100 | #222 | Tragic 2.3% |
| Immigrants | Lebanon | 4.5 /100 | #223 | Tragic 2.3% |
| Tohono O'odham | 4.1 /100 | #224 | Tragic 2.3% |
| Sudanese | 4.1 /100 | #225 | Tragic 2.3% |
| Sierra Leoneans | 4.1 /100 | #226 | Tragic 2.3% |
| Immigrants | Uganda | 4.0 /100 | #227 | Tragic 2.3% |
| U.S. Virgin Islanders | 3.7 /100 | #228 | Tragic 2.3% |
| Immigrants | Pakistan | 3.6 /100 | #229 | Tragic 2.3% |
| Puerto Ricans | 3.4 /100 | #230 | Tragic 2.3% |
| Immigrants | Uruguay | 3.4 /100 | #231 | Tragic 2.3% |
Demographics Similar to Nepalese by No Schooling Completed
In terms of no schooling completed, the demographic groups most similar to Nepalese are Salvadoran (3.7%, a difference of 1.7%), Immigrants from El Salvador (3.9%, a difference of 1.8%), Immigrants from Mexico (3.6%, a difference of 4.5%), Immigrants from Central America (3.6%, a difference of 5.3%), and Immigrants from Guatemala (3.6%, a difference of 6.4%).
| Demographics | Rating | Rank | No Schooling Completed |
| Immigrants | Dominican Republic | 0.0 /100 | #333 | Tragic 3.4% |
| Guatemalans | 0.0 /100 | #334 | Tragic 3.5% |
| Immigrants | Cambodia | 0.0 /100 | #335 | Tragic 3.5% |
| Immigrants | Fiji | 0.0 /100 | #336 | Tragic 3.5% |
| Immigrants | Cabo Verde | 0.0 /100 | #337 | Tragic 3.5% |
| Bangladeshis | 0.0 /100 | #338 | Tragic 3.5% |
| Yakama | 0.0 /100 | #339 | Tragic 3.6% |
| Immigrants | Guatemala | 0.0 /100 | #340 | Tragic 3.6% |
| Immigrants | Central America | 0.0 /100 | #341 | Tragic 3.6% |
| Immigrants | Mexico | 0.0 /100 | #342 | Tragic 3.6% |
| Salvadorans | 0.0 /100 | #343 | Tragic 3.7% |
| Nepalese | 0.0 /100 | #344 | Tragic 3.8% |
| Immigrants | El Salvador | 0.0 /100 | #345 | Tragic 3.9% |
| Immigrants | Yemen | 0.0 /100 | #346 | Tragic 4.1% |
| Spanish American Indians | 0.0 /100 | #347 | Tragic 4.2% |