Marshallese vs Scandinavian Per Capita Income
COMPARE
Marshallese
Scandinavian
Per Capita Income
Per Capita Income Comparison
Marshallese
Scandinavians
$39,108
PER CAPITA INCOME
0.6/ 100
METRIC RATING
261st/ 347
METRIC RANK
$43,848
PER CAPITA INCOME
55.2/ 100
METRIC RATING
170th/ 347
METRIC RANK
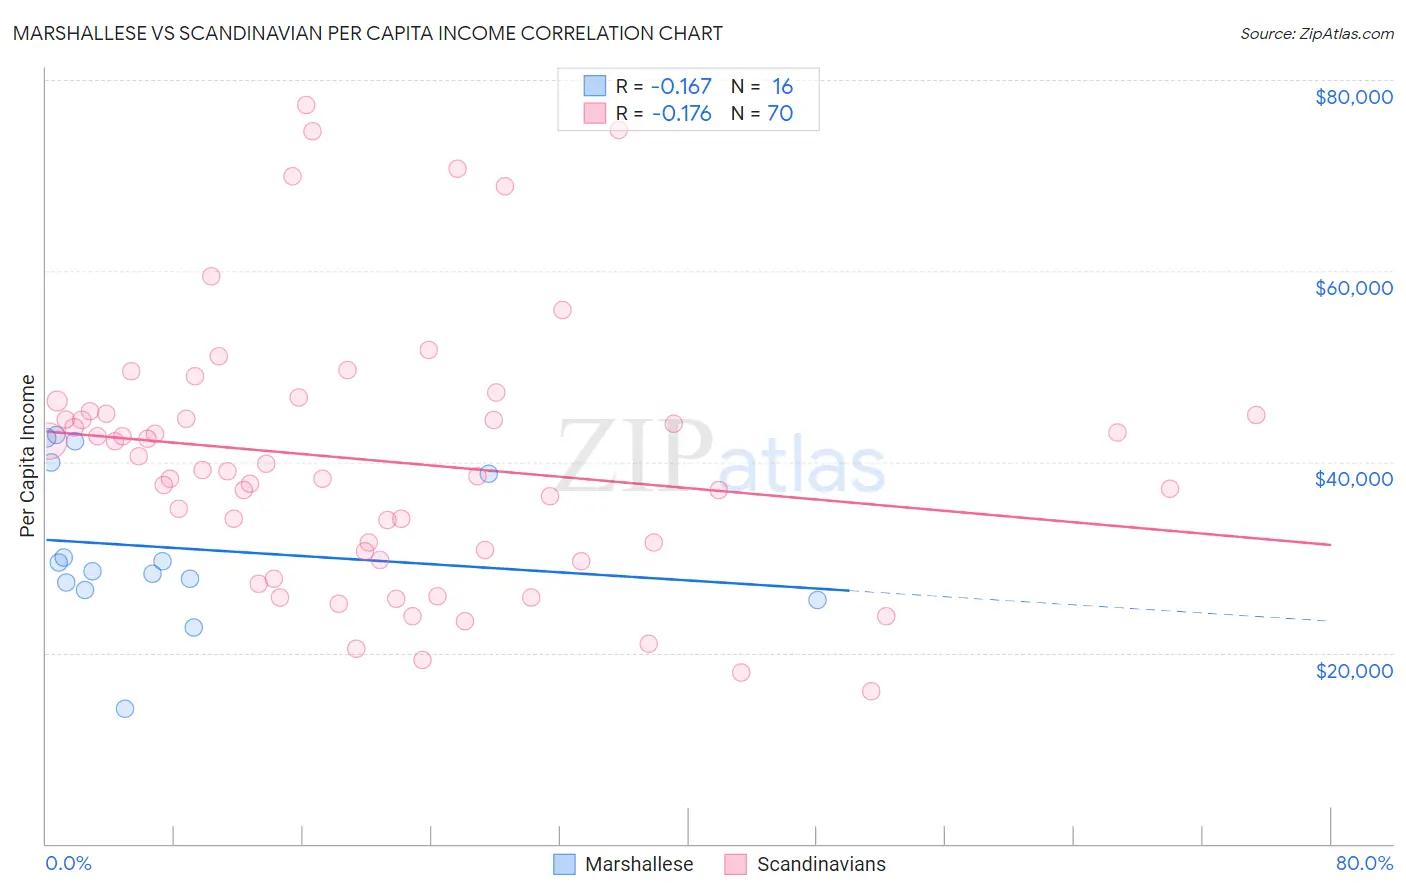
Marshallese vs Scandinavian Per Capita Income Correlation Chart
The statistical analysis conducted on geographies consisting of 14,761,315 people shows a poor negative correlation between the proportion of Marshallese and per capita income in the United States with a correlation coefficient (R) of -0.167 and weighted average of $39,108. Similarly, the statistical analysis conducted on geographies consisting of 472,676,138 people shows a poor negative correlation between the proportion of Scandinavians and per capita income in the United States with a correlation coefficient (R) of -0.176 and weighted average of $43,848, a difference of 12.1%.
Per Capita Income Correlation Summary
| Measurement | Marshallese | Scandinavian |
| Minimum | $14,082 | $15,911 |
| Maximum | $42,763 | $77,383 |
| Range | $28,681 | $61,472 |
| Mean | $31,016 | $40,106 |
| Median | $29,047 | $39,048 |
| Interquartile 25% (IQ1) | $26,970 | $30,666 |
| Interquartile 75% (IQ3) | $39,382 | $45,055 |
| Interquartile Range (IQR) | $12,413 | $14,389 |
| Standard Deviation (Sample) | $8,089 | $13,782 |
| Standard Deviation (Population) | $7,833 | $13,683 |
Similar Demographics by Per Capita Income
Demographics Similar to Marshallese by Per Capita Income
In terms of per capita income, the demographic groups most similar to Marshallese are Iroquois ($39,104, a difference of 0.010%), Belizean ($39,097, a difference of 0.030%), Alaskan Athabascan ($39,163, a difference of 0.14%), American ($39,039, a difference of 0.17%), and Malaysian ($39,194, a difference of 0.22%).
| Demographics | Rating | Rank | Per Capita Income |
| Alaska Natives | 1.0 /100 | #254 | Tragic $39,558 |
| Immigrants | Middle Africa | 1.0 /100 | #255 | Tragic $39,529 |
| Hawaiians | 0.8 /100 | #256 | Tragic $39,403 |
| Nicaraguans | 0.8 /100 | #257 | Tragic $39,372 |
| Jamaicans | 0.7 /100 | #258 | Tragic $39,231 |
| Malaysians | 0.7 /100 | #259 | Tragic $39,194 |
| Alaskan Athabascans | 0.6 /100 | #260 | Tragic $39,163 |
| Marshallese | 0.6 /100 | #261 | Tragic $39,108 |
| Iroquois | 0.6 /100 | #262 | Tragic $39,104 |
| Belizeans | 0.6 /100 | #263 | Tragic $39,097 |
| Americans | 0.6 /100 | #264 | Tragic $39,039 |
| Spanish Americans | 0.5 /100 | #265 | Tragic $39,012 |
| Salvadorans | 0.5 /100 | #266 | Tragic $38,858 |
| Immigrants | Zaire | 0.4 /100 | #267 | Tragic $38,848 |
| Liberians | 0.4 /100 | #268 | Tragic $38,780 |
Demographics Similar to Scandinavians by Per Capita Income
In terms of per capita income, the demographic groups most similar to Scandinavians are Immigrants from Peru ($43,852, a difference of 0.010%), Immigrants from Eastern Africa ($43,838, a difference of 0.020%), Czechoslovakian ($43,806, a difference of 0.090%), Belgian ($43,951, a difference of 0.24%), and English ($43,982, a difference of 0.31%).
| Demographics | Rating | Rank | Per Capita Income |
| Immigrants | South America | 61.2 /100 | #163 | Good $44,068 |
| Sri Lankans | 59.8 /100 | #164 | Average $44,014 |
| Immigrants | Philippines | 59.4 /100 | #165 | Average $44,000 |
| Immigrants | Uruguay | 59.3 /100 | #166 | Average $43,997 |
| English | 58.9 /100 | #167 | Average $43,982 |
| Belgians | 58.1 /100 | #168 | Average $43,951 |
| Immigrants | Peru | 55.3 /100 | #169 | Average $43,852 |
| Scandinavians | 55.2 /100 | #170 | Average $43,848 |
| Immigrants | Eastern Africa | 54.9 /100 | #171 | Average $43,838 |
| Czechoslovakians | 54.1 /100 | #172 | Average $43,806 |
| French | 50.7 /100 | #173 | Average $43,685 |
| Colombians | 50.0 /100 | #174 | Average $43,661 |
| Celtics | 48.9 /100 | #175 | Average $43,621 |
| Immigrants | South Eastern Asia | 46.6 /100 | #176 | Average $43,539 |
| Tlingit-Haida | 45.9 /100 | #177 | Average $43,516 |