Tlingit-Haida vs British West Indian Per Capita Income
COMPARE
Tlingit-Haida
British West Indian
Per Capita Income
Per Capita Income Comparison
Tlingit-Haida
British West Indians
$43,516
PER CAPITA INCOME
45.9/ 100
METRIC RATING
177th/ 347
METRIC RANK
$40,330
PER CAPITA INCOME
2.3/ 100
METRIC RATING
241st/ 347
METRIC RANK
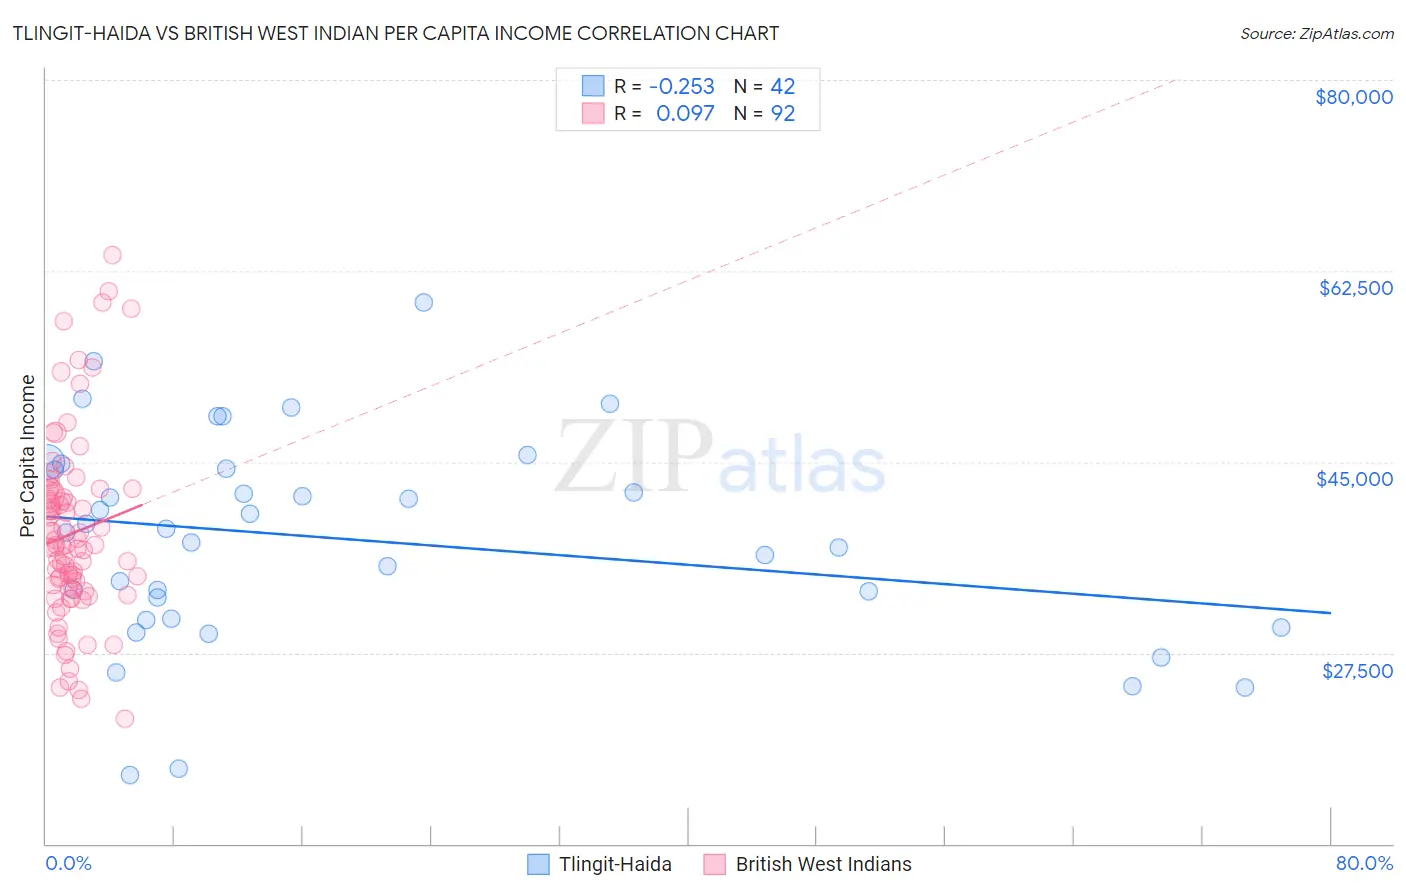
Tlingit-Haida vs British West Indian Per Capita Income Correlation Chart
The statistical analysis conducted on geographies consisting of 60,872,339 people shows a weak negative correlation between the proportion of Tlingit-Haida and per capita income in the United States with a correlation coefficient (R) of -0.253 and weighted average of $43,516. Similarly, the statistical analysis conducted on geographies consisting of 152,702,927 people shows a slight positive correlation between the proportion of British West Indians and per capita income in the United States with a correlation coefficient (R) of 0.097 and weighted average of $40,330, a difference of 7.9%.
Per Capita Income Correlation Summary
| Measurement | Tlingit-Haida | British West Indian |
| Minimum | $16,326 | $21,502 |
| Maximum | $59,619 | $63,988 |
| Range | $43,293 | $42,486 |
| Mean | $37,894 | $38,416 |
| Median | $38,682 | $37,296 |
| Interquartile 25% (IQ1) | $30,599 | $33,460 |
| Interquartile 75% (IQ3) | $44,372 | $42,145 |
| Interquartile Range (IQR) | $13,773 | $8,686 |
| Standard Deviation (Sample) | $9,586 | $8,471 |
| Standard Deviation (Population) | $9,471 | $8,425 |
Similar Demographics by Per Capita Income
Demographics Similar to Tlingit-Haida by Per Capita Income
In terms of per capita income, the demographic groups most similar to Tlingit-Haida are Immigrants from South Eastern Asia ($43,539, a difference of 0.050%), Immigrants from Costa Rica ($43,464, a difference of 0.12%), Finnish ($43,461, a difference of 0.13%), Celtic ($43,621, a difference of 0.24%), and Sierra Leonean ($43,405, a difference of 0.25%).
| Demographics | Rating | Rank | Per Capita Income |
| Scandinavians | 55.2 /100 | #170 | Average $43,848 |
| Immigrants | Eastern Africa | 54.9 /100 | #171 | Average $43,838 |
| Czechoslovakians | 54.1 /100 | #172 | Average $43,806 |
| French | 50.7 /100 | #173 | Average $43,685 |
| Colombians | 50.0 /100 | #174 | Average $43,661 |
| Celtics | 48.9 /100 | #175 | Average $43,621 |
| Immigrants | South Eastern Asia | 46.6 /100 | #176 | Average $43,539 |
| Tlingit-Haida | 45.9 /100 | #177 | Average $43,516 |
| Immigrants | Costa Rica | 44.5 /100 | #178 | Average $43,464 |
| Finns | 44.4 /100 | #179 | Average $43,461 |
| Sierra Leoneans | 42.9 /100 | #180 | Average $43,405 |
| Welsh | 38.2 /100 | #181 | Fair $43,233 |
| Immigrants | Vietnam | 38.1 /100 | #182 | Fair $43,229 |
| Germans | 33.9 /100 | #183 | Fair $43,067 |
| Spaniards | 32.9 /100 | #184 | Fair $43,028 |
Demographics Similar to British West Indians by Per Capita Income
In terms of per capita income, the demographic groups most similar to British West Indians are Immigrants from Nigeria ($40,339, a difference of 0.020%), Tsimshian ($40,344, a difference of 0.040%), Somali ($40,367, a difference of 0.090%), Immigrants from Western Africa ($40,294, a difference of 0.090%), and German Russian ($40,266, a difference of 0.16%).
| Demographics | Rating | Rank | Per Capita Income |
| Immigrants | West Indies | 3.7 /100 | #234 | Tragic $40,763 |
| Immigrants | Guyana | 3.6 /100 | #235 | Tragic $40,742 |
| Immigrants | Nonimmigrants | 3.4 /100 | #236 | Tragic $40,669 |
| Immigrants | Cambodia | 2.6 /100 | #237 | Tragic $40,434 |
| Somalis | 2.4 /100 | #238 | Tragic $40,367 |
| Tsimshian | 2.4 /100 | #239 | Tragic $40,344 |
| Immigrants | Nigeria | 2.3 /100 | #240 | Tragic $40,339 |
| British West Indians | 2.3 /100 | #241 | Tragic $40,330 |
| Immigrants | Western Africa | 2.2 /100 | #242 | Tragic $40,294 |
| German Russians | 2.2 /100 | #243 | Tragic $40,266 |
| French American Indians | 2.1 /100 | #244 | Tragic $40,244 |
| Sub-Saharan Africans | 1.9 /100 | #245 | Tragic $40,152 |
| Cree | 1.7 /100 | #246 | Tragic $40,056 |
| Immigrants | Somalia | 1.6 /100 | #247 | Tragic $39,974 |
| Cape Verdeans | 1.5 /100 | #248 | Tragic $39,935 |