Shoshone vs Scandinavian Per Capita Income
COMPARE
Shoshone
Scandinavian
Per Capita Income
Per Capita Income Comparison
Shoshone
Scandinavians
$37,072
PER CAPITA INCOME
0.1/ 100
METRIC RATING
302nd/ 347
METRIC RANK
$43,848
PER CAPITA INCOME
55.2/ 100
METRIC RATING
170th/ 347
METRIC RANK
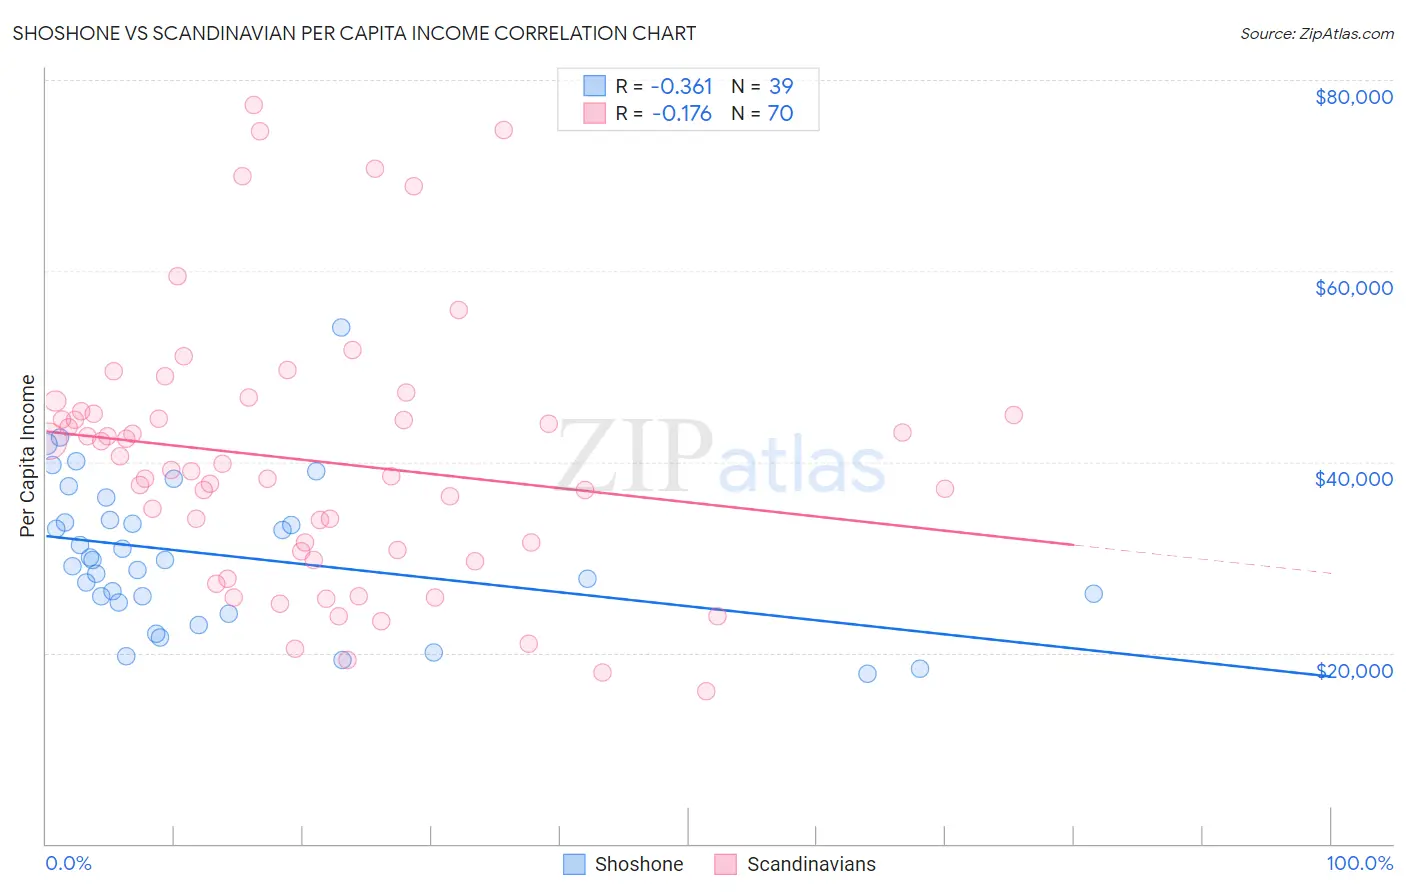
Shoshone vs Scandinavian Per Capita Income Correlation Chart
The statistical analysis conducted on geographies consisting of 66,627,177 people shows a mild negative correlation between the proportion of Shoshone and per capita income in the United States with a correlation coefficient (R) of -0.361 and weighted average of $37,072. Similarly, the statistical analysis conducted on geographies consisting of 472,676,138 people shows a poor negative correlation between the proportion of Scandinavians and per capita income in the United States with a correlation coefficient (R) of -0.176 and weighted average of $43,848, a difference of 18.3%.
Per Capita Income Correlation Summary
| Measurement | Shoshone | Scandinavian |
| Minimum | $17,814 | $15,911 |
| Maximum | $54,019 | $77,383 |
| Range | $36,205 | $61,472 |
| Mean | $30,204 | $40,106 |
| Median | $29,691 | $39,048 |
| Interquartile 25% (IQ1) | $25,299 | $30,666 |
| Interquartile 75% (IQ3) | $33,868 | $45,055 |
| Interquartile Range (IQR) | $8,569 | $14,389 |
| Standard Deviation (Sample) | $7,800 | $13,782 |
| Standard Deviation (Population) | $7,700 | $13,683 |
Similar Demographics by Per Capita Income
Demographics Similar to Shoshone by Per Capita Income
In terms of per capita income, the demographic groups most similar to Shoshone are Paiute ($37,066, a difference of 0.020%), Ottawa ($37,101, a difference of 0.080%), Honduran ($37,031, a difference of 0.11%), Inupiat ($36,999, a difference of 0.20%), and Immigrants from Bahamas ($37,193, a difference of 0.33%).
| Demographics | Rating | Rank | Per Capita Income |
| Immigrants | Dominican Republic | 0.1 /100 | #295 | Tragic $37,306 |
| Indonesians | 0.1 /100 | #296 | Tragic $37,300 |
| Haitians | 0.1 /100 | #297 | Tragic $37,289 |
| Immigrants | Caribbean | 0.1 /100 | #298 | Tragic $37,254 |
| Cherokee | 0.1 /100 | #299 | Tragic $37,203 |
| Immigrants | Bahamas | 0.1 /100 | #300 | Tragic $37,193 |
| Ottawa | 0.1 /100 | #301 | Tragic $37,101 |
| Shoshone | 0.1 /100 | #302 | Tragic $37,072 |
| Paiute | 0.1 /100 | #303 | Tragic $37,066 |
| Hondurans | 0.1 /100 | #304 | Tragic $37,031 |
| Inupiat | 0.1 /100 | #305 | Tragic $36,999 |
| Immigrants | Haiti | 0.0 /100 | #306 | Tragic $36,849 |
| Immigrants | Latin America | 0.0 /100 | #307 | Tragic $36,823 |
| Fijians | 0.0 /100 | #308 | Tragic $36,690 |
| Immigrants | Honduras | 0.0 /100 | #309 | Tragic $36,665 |
Demographics Similar to Scandinavians by Per Capita Income
In terms of per capita income, the demographic groups most similar to Scandinavians are Immigrants from Peru ($43,852, a difference of 0.010%), Immigrants from Eastern Africa ($43,838, a difference of 0.020%), Czechoslovakian ($43,806, a difference of 0.090%), Belgian ($43,951, a difference of 0.24%), and English ($43,982, a difference of 0.31%).
| Demographics | Rating | Rank | Per Capita Income |
| Immigrants | South America | 61.2 /100 | #163 | Good $44,068 |
| Sri Lankans | 59.8 /100 | #164 | Average $44,014 |
| Immigrants | Philippines | 59.4 /100 | #165 | Average $44,000 |
| Immigrants | Uruguay | 59.3 /100 | #166 | Average $43,997 |
| English | 58.9 /100 | #167 | Average $43,982 |
| Belgians | 58.1 /100 | #168 | Average $43,951 |
| Immigrants | Peru | 55.3 /100 | #169 | Average $43,852 |
| Scandinavians | 55.2 /100 | #170 | Average $43,848 |
| Immigrants | Eastern Africa | 54.9 /100 | #171 | Average $43,838 |
| Czechoslovakians | 54.1 /100 | #172 | Average $43,806 |
| French | 50.7 /100 | #173 | Average $43,685 |
| Colombians | 50.0 /100 | #174 | Average $43,661 |
| Celtics | 48.9 /100 | #175 | Average $43,621 |
| Immigrants | South Eastern Asia | 46.6 /100 | #176 | Average $43,539 |
| Tlingit-Haida | 45.9 /100 | #177 | Average $43,516 |