Tlingit-Haida vs Immigrants from Dominica Per Capita Income
COMPARE
Tlingit-Haida
Immigrants from Dominica
Per Capita Income
Per Capita Income Comparison
Tlingit-Haida
Immigrants from Dominica
$43,516
PER CAPITA INCOME
45.9/ 100
METRIC RATING
177th/ 347
METRIC RANK
$37,952
PER CAPITA INCOME
0.2/ 100
METRIC RATING
281st/ 347
METRIC RANK
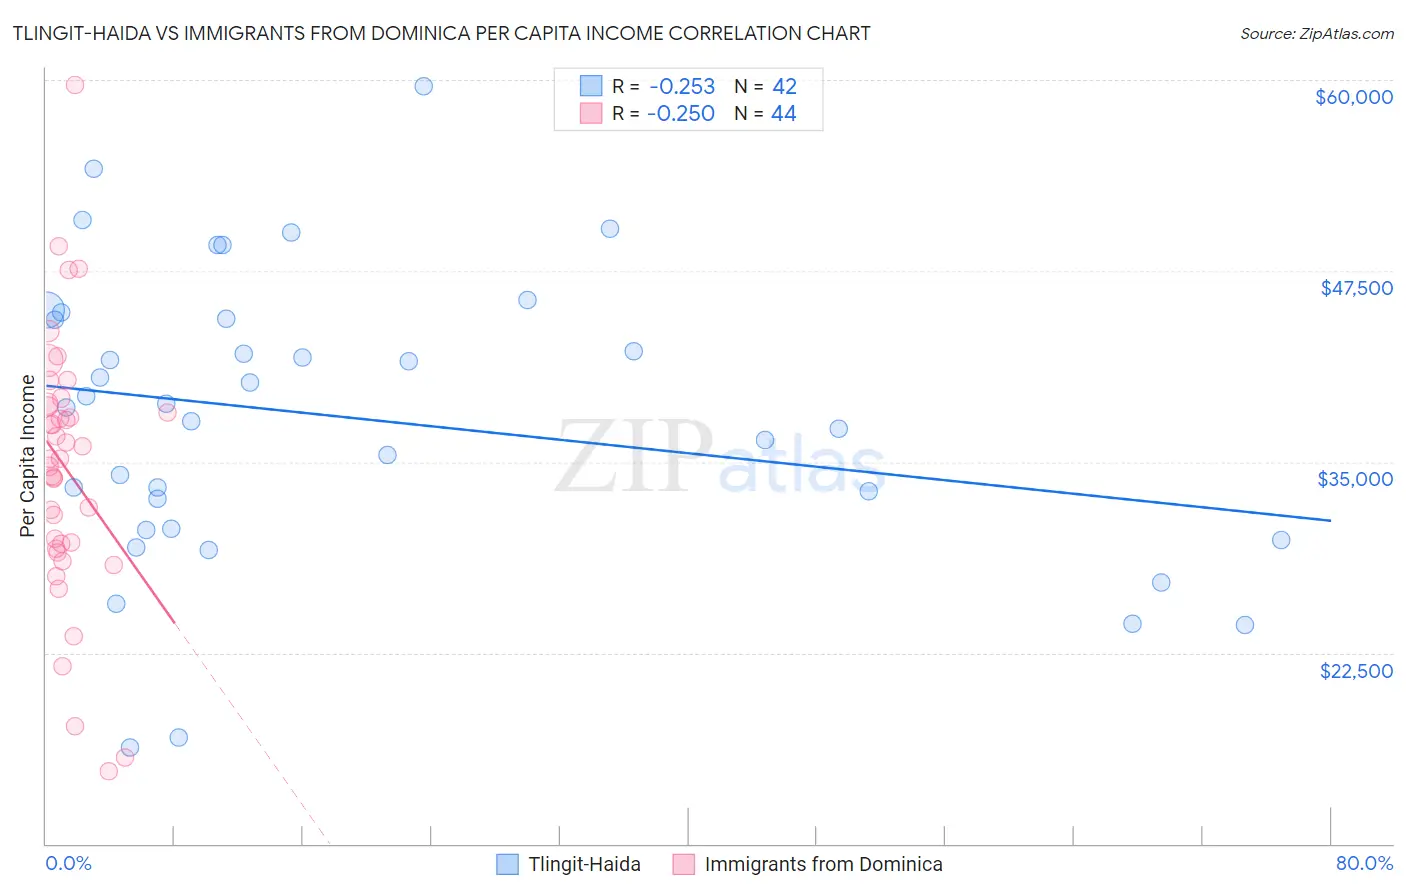
Tlingit-Haida vs Immigrants from Dominica Per Capita Income Correlation Chart
The statistical analysis conducted on geographies consisting of 60,872,339 people shows a weak negative correlation between the proportion of Tlingit-Haida and per capita income in the United States with a correlation coefficient (R) of -0.253 and weighted average of $43,516. Similarly, the statistical analysis conducted on geographies consisting of 83,794,667 people shows a weak negative correlation between the proportion of Immigrants from Dominica and per capita income in the United States with a correlation coefficient (R) of -0.250 and weighted average of $37,952, a difference of 14.7%.
Per Capita Income Correlation Summary
| Measurement | Tlingit-Haida | Immigrants from Dominica |
| Minimum | $16,326 | $14,729 |
| Maximum | $59,619 | $59,651 |
| Range | $43,293 | $44,922 |
| Mean | $37,894 | $34,508 |
| Median | $38,682 | $35,220 |
| Interquartile 25% (IQ1) | $30,599 | $29,494 |
| Interquartile 75% (IQ3) | $44,372 | $38,721 |
| Interquartile Range (IQR) | $13,773 | $9,227 |
| Standard Deviation (Sample) | $9,586 | $8,665 |
| Standard Deviation (Population) | $9,471 | $8,566 |
Similar Demographics by Per Capita Income
Demographics Similar to Tlingit-Haida by Per Capita Income
In terms of per capita income, the demographic groups most similar to Tlingit-Haida are Immigrants from South Eastern Asia ($43,539, a difference of 0.050%), Immigrants from Costa Rica ($43,464, a difference of 0.12%), Finnish ($43,461, a difference of 0.13%), Celtic ($43,621, a difference of 0.24%), and Sierra Leonean ($43,405, a difference of 0.25%).
| Demographics | Rating | Rank | Per Capita Income |
| Scandinavians | 55.2 /100 | #170 | Average $43,848 |
| Immigrants | Eastern Africa | 54.9 /100 | #171 | Average $43,838 |
| Czechoslovakians | 54.1 /100 | #172 | Average $43,806 |
| French | 50.7 /100 | #173 | Average $43,685 |
| Colombians | 50.0 /100 | #174 | Average $43,661 |
| Celtics | 48.9 /100 | #175 | Average $43,621 |
| Immigrants | South Eastern Asia | 46.6 /100 | #176 | Average $43,539 |
| Tlingit-Haida | 45.9 /100 | #177 | Average $43,516 |
| Immigrants | Costa Rica | 44.5 /100 | #178 | Average $43,464 |
| Finns | 44.4 /100 | #179 | Average $43,461 |
| Sierra Leoneans | 42.9 /100 | #180 | Average $43,405 |
| Welsh | 38.2 /100 | #181 | Fair $43,233 |
| Immigrants | Vietnam | 38.1 /100 | #182 | Fair $43,229 |
| Germans | 33.9 /100 | #183 | Fair $43,067 |
| Spaniards | 32.9 /100 | #184 | Fair $43,028 |
Demographics Similar to Immigrants from Dominica by Per Capita Income
In terms of per capita income, the demographic groups most similar to Immigrants from Dominica are Colville ($38,047, a difference of 0.25%), Potawatomi ($38,046, a difference of 0.25%), Immigrants from Laos ($37,857, a difference of 0.25%), Pennsylvania German ($37,842, a difference of 0.29%), and Immigrants from Nicaragua ($38,065, a difference of 0.30%).
| Demographics | Rating | Rank | Per Capita Income |
| Immigrants | El Salvador | 0.3 /100 | #274 | Tragic $38,394 |
| Immigrants | Liberia | 0.2 /100 | #275 | Tragic $38,165 |
| Hmong | 0.2 /100 | #276 | Tragic $38,120 |
| Comanche | 0.2 /100 | #277 | Tragic $38,088 |
| Immigrants | Nicaragua | 0.2 /100 | #278 | Tragic $38,065 |
| Colville | 0.2 /100 | #279 | Tragic $38,047 |
| Potawatomi | 0.2 /100 | #280 | Tragic $38,046 |
| Immigrants | Dominica | 0.2 /100 | #281 | Tragic $37,952 |
| Immigrants | Laos | 0.1 /100 | #282 | Tragic $37,857 |
| Pennsylvania Germans | 0.1 /100 | #283 | Tragic $37,842 |
| Africans | 0.1 /100 | #284 | Tragic $37,785 |
| Guatemalans | 0.1 /100 | #285 | Tragic $37,766 |
| Central American Indians | 0.1 /100 | #286 | Tragic $37,699 |
| Dominicans | 0.1 /100 | #287 | Tragic $37,697 |
| Blackfeet | 0.1 /100 | #288 | Tragic $37,695 |