Immigrants from Dominica vs Hawaiian Median Family Income
COMPARE
Immigrants from Dominica
Hawaiian
Median Family Income
Median Family Income Comparison
Immigrants from Dominica
Hawaiians
$85,411
MEDIAN FAMILY INCOME
0.0/ 100
METRIC RATING
306th/ 347
METRIC RANK
$98,869
MEDIAN FAMILY INCOME
12.5/ 100
METRIC RATING
205th/ 347
METRIC RANK
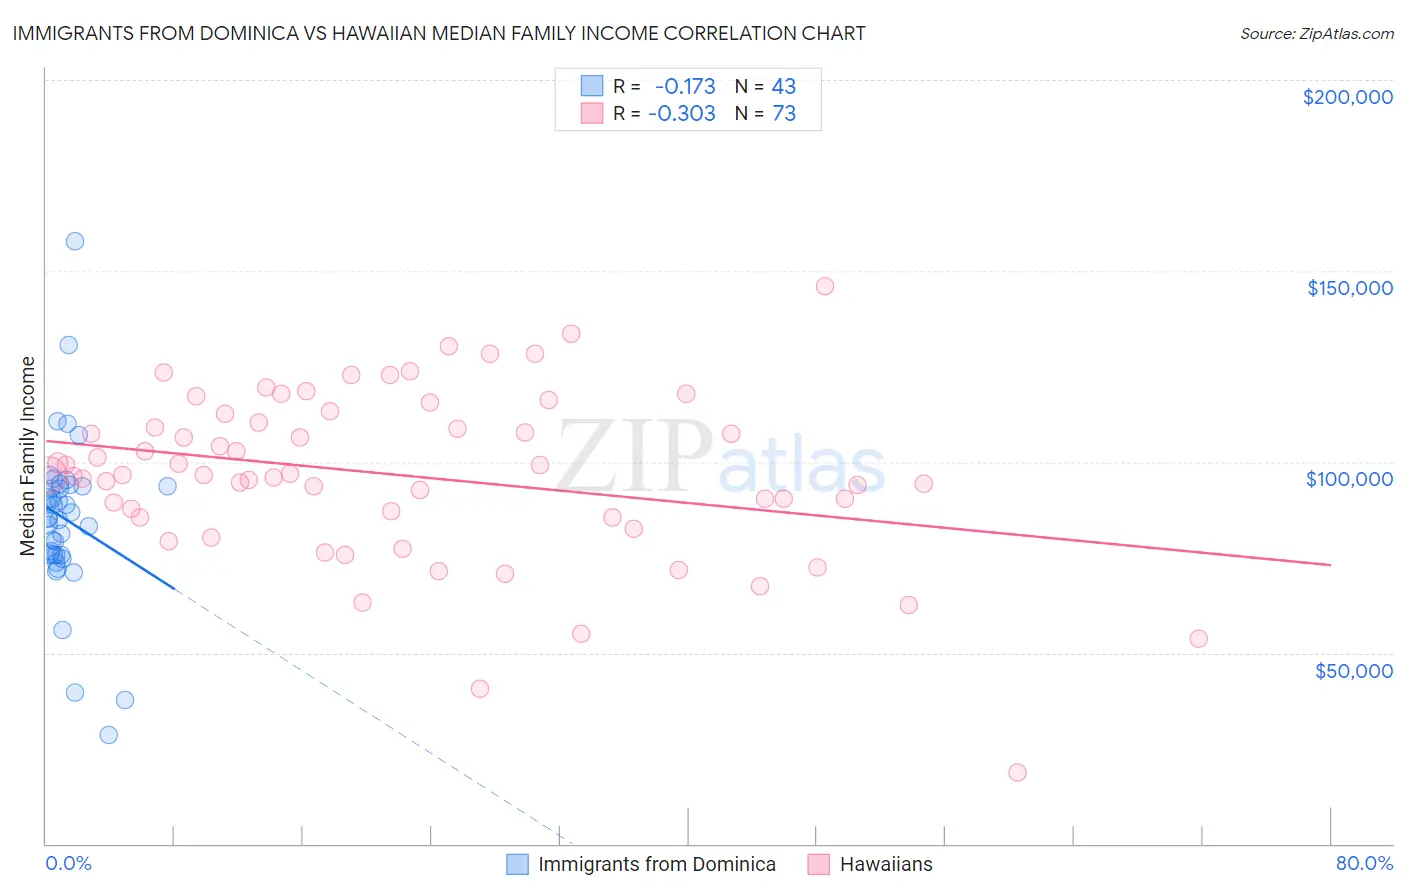
Immigrants from Dominica vs Hawaiian Median Family Income Correlation Chart
The statistical analysis conducted on geographies consisting of 83,779,139 people shows a poor negative correlation between the proportion of Immigrants from Dominica and median family income in the United States with a correlation coefficient (R) of -0.173 and weighted average of $85,411. Similarly, the statistical analysis conducted on geographies consisting of 327,312,132 people shows a mild negative correlation between the proportion of Hawaiians and median family income in the United States with a correlation coefficient (R) of -0.303 and weighted average of $98,869, a difference of 15.8%.
Median Family Income Correlation Summary
| Measurement | Immigrants from Dominica | Hawaiian |
| Minimum | $28,616 | $18,796 |
| Maximum | $157,838 | $146,000 |
| Range | $129,222 | $127,204 |
| Mean | $84,989 | $96,414 |
| Median | $85,349 | $96,571 |
| Interquartile 25% (IQ1) | $75,527 | $85,564 |
| Interquartile 75% (IQ3) | $93,750 | $111,384 |
| Interquartile Range (IQR) | $18,223 | $25,820 |
| Standard Deviation (Sample) | $21,651 | $22,234 |
| Standard Deviation (Population) | $21,398 | $22,081 |
Similar Demographics by Median Family Income
Demographics Similar to Immigrants from Dominica by Median Family Income
In terms of median family income, the demographic groups most similar to Immigrants from Dominica are Paiute ($85,414, a difference of 0.0%), Chickasaw ($85,356, a difference of 0.060%), U.S. Virgin Islander ($85,294, a difference of 0.14%), Haitian ($85,218, a difference of 0.23%), and Mexican ($85,618, a difference of 0.24%).
| Demographics | Rating | Rank | Median Family Income |
| Chippewa | 0.0 /100 | #299 | Tragic $86,852 |
| Ottawa | 0.0 /100 | #300 | Tragic $86,380 |
| Colville | 0.0 /100 | #301 | Tragic $85,792 |
| Spanish American Indians | 0.0 /100 | #302 | Tragic $85,728 |
| Hispanics or Latinos | 0.0 /100 | #303 | Tragic $85,647 |
| Mexicans | 0.0 /100 | #304 | Tragic $85,618 |
| Paiute | 0.0 /100 | #305 | Tragic $85,414 |
| Immigrants | Dominica | 0.0 /100 | #306 | Tragic $85,411 |
| Chickasaw | 0.0 /100 | #307 | Tragic $85,356 |
| U.S. Virgin Islanders | 0.0 /100 | #308 | Tragic $85,294 |
| Haitians | 0.0 /100 | #309 | Tragic $85,218 |
| Immigrants | Central America | 0.0 /100 | #310 | Tragic $85,050 |
| Hondurans | 0.0 /100 | #311 | Tragic $85,004 |
| Cubans | 0.0 /100 | #312 | Tragic $84,981 |
| Choctaw | 0.0 /100 | #313 | Tragic $84,835 |
Demographics Similar to Hawaiians by Median Family Income
In terms of median family income, the demographic groups most similar to Hawaiians are Ghanaian ($98,877, a difference of 0.010%), Immigrants from Iraq ($98,786, a difference of 0.080%), Aleut ($98,702, a difference of 0.17%), Immigrants from Uruguay ($98,205, a difference of 0.68%), and Scotch-Irish ($99,591, a difference of 0.73%).
| Demographics | Rating | Rank | Median Family Income |
| Immigrants | Africa | 22.5 /100 | #198 | Fair $100,256 |
| Yugoslavians | 21.3 /100 | #199 | Fair $100,119 |
| Spanish | 20.1 /100 | #200 | Fair $99,977 |
| Immigrants | Thailand | 19.0 /100 | #201 | Poor $99,840 |
| Whites/Caucasians | 18.7 /100 | #202 | Poor $99,800 |
| Scotch-Irish | 17.1 /100 | #203 | Poor $99,591 |
| Ghanaians | 12.6 /100 | #204 | Poor $98,877 |
| Hawaiians | 12.5 /100 | #205 | Poor $98,869 |
| Immigrants | Iraq | 12.1 /100 | #206 | Poor $98,786 |
| Aleuts | 11.6 /100 | #207 | Poor $98,702 |
| Immigrants | Uruguay | 9.2 /100 | #208 | Tragic $98,205 |
| Immigrants | Colombia | 8.7 /100 | #209 | Tragic $98,067 |
| Puget Sound Salish | 8.2 /100 | #210 | Tragic $97,958 |
| Immigrants | Sudan | 7.4 /100 | #211 | Tragic $97,737 |
| Panamanians | 7.2 /100 | #212 | Tragic $97,683 |