Immigrants from South Eastern Asia vs Hawaiian Median Family Income
COMPARE
Immigrants from South Eastern Asia
Hawaiian
Median Family Income
Median Family Income Comparison
Immigrants from South Eastern Asia
Hawaiians
$106,252
MEDIAN FAMILY INCOME
86.1/ 100
METRIC RATING
136th/ 347
METRIC RANK
$98,869
MEDIAN FAMILY INCOME
12.5/ 100
METRIC RATING
205th/ 347
METRIC RANK
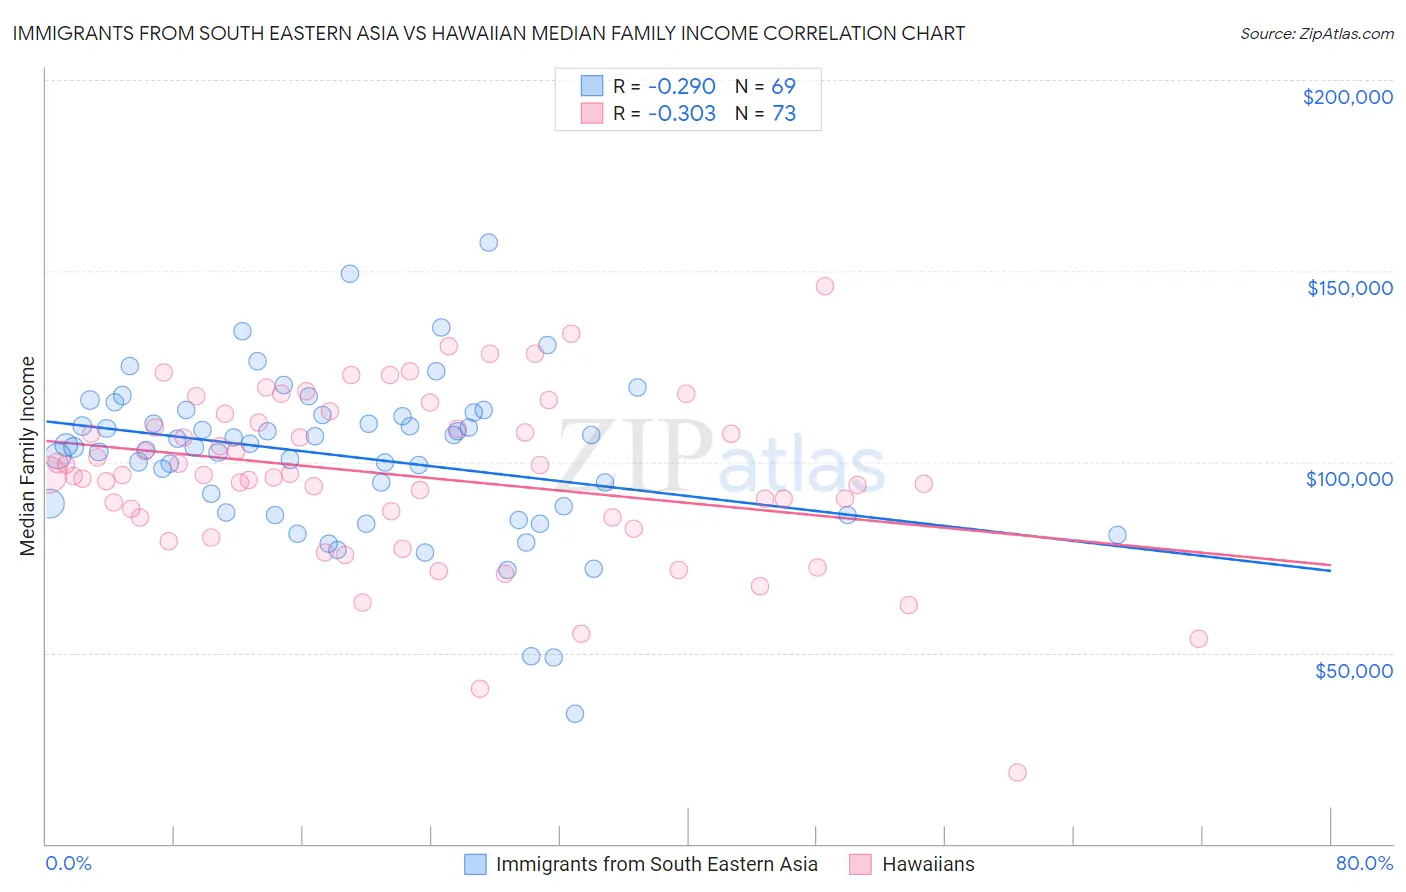
Immigrants from South Eastern Asia vs Hawaiian Median Family Income Correlation Chart
The statistical analysis conducted on geographies consisting of 511,889,234 people shows a weak negative correlation between the proportion of Immigrants from South Eastern Asia and median family income in the United States with a correlation coefficient (R) of -0.290 and weighted average of $106,252. Similarly, the statistical analysis conducted on geographies consisting of 327,312,132 people shows a mild negative correlation between the proportion of Hawaiians and median family income in the United States with a correlation coefficient (R) of -0.303 and weighted average of $98,869, a difference of 7.5%.
Median Family Income Correlation Summary
| Measurement | Immigrants from South Eastern Asia | Hawaiian |
| Minimum | $34,076 | $18,796 |
| Maximum | $157,444 | $146,000 |
| Range | $123,368 | $127,204 |
| Mean | $101,571 | $96,414 |
| Median | $104,465 | $96,571 |
| Interquartile 25% (IQ1) | $87,571 | $85,564 |
| Interquartile 75% (IQ3) | $112,620 | $111,384 |
| Interquartile Range (IQR) | $25,049 | $25,820 |
| Standard Deviation (Sample) | $21,051 | $22,234 |
| Standard Deviation (Population) | $20,898 | $22,081 |
Similar Demographics by Median Family Income
Demographics Similar to Immigrants from South Eastern Asia by Median Family Income
In terms of median family income, the demographic groups most similar to Immigrants from South Eastern Asia are Portuguese ($106,286, a difference of 0.030%), Immigrants from Uganda ($106,188, a difference of 0.060%), Immigrants from Vietnam ($106,186, a difference of 0.060%), Luxembourger ($106,183, a difference of 0.060%), and Norwegian ($106,144, a difference of 0.10%).
| Demographics | Rating | Rank | Median Family Income |
| Arabs | 89.9 /100 | #129 | Excellent $106,952 |
| Brazilians | 89.8 /100 | #130 | Excellent $106,942 |
| Canadians | 88.1 /100 | #131 | Excellent $106,597 |
| Immigrants | Fiji | 87.8 /100 | #132 | Excellent $106,544 |
| Ugandans | 87.8 /100 | #133 | Excellent $106,541 |
| Immigrants | Oceania | 87.3 /100 | #134 | Excellent $106,453 |
| Portuguese | 86.3 /100 | #135 | Excellent $106,286 |
| Immigrants | South Eastern Asia | 86.1 /100 | #136 | Excellent $106,252 |
| Immigrants | Uganda | 85.7 /100 | #137 | Excellent $106,188 |
| Immigrants | Vietnam | 85.7 /100 | #138 | Excellent $106,186 |
| Luxembourgers | 85.7 /100 | #139 | Excellent $106,183 |
| Norwegians | 85.5 /100 | #140 | Excellent $106,144 |
| Immigrants | Syria | 85.3 /100 | #141 | Excellent $106,118 |
| Slovenes | 84.7 /100 | #142 | Excellent $106,020 |
| Tongans | 84.3 /100 | #143 | Excellent $105,967 |
Demographics Similar to Hawaiians by Median Family Income
In terms of median family income, the demographic groups most similar to Hawaiians are Ghanaian ($98,877, a difference of 0.010%), Immigrants from Iraq ($98,786, a difference of 0.080%), Aleut ($98,702, a difference of 0.17%), Immigrants from Uruguay ($98,205, a difference of 0.68%), and Scotch-Irish ($99,591, a difference of 0.73%).
| Demographics | Rating | Rank | Median Family Income |
| Immigrants | Africa | 22.5 /100 | #198 | Fair $100,256 |
| Yugoslavians | 21.3 /100 | #199 | Fair $100,119 |
| Spanish | 20.1 /100 | #200 | Fair $99,977 |
| Immigrants | Thailand | 19.0 /100 | #201 | Poor $99,840 |
| Whites/Caucasians | 18.7 /100 | #202 | Poor $99,800 |
| Scotch-Irish | 17.1 /100 | #203 | Poor $99,591 |
| Ghanaians | 12.6 /100 | #204 | Poor $98,877 |
| Hawaiians | 12.5 /100 | #205 | Poor $98,869 |
| Immigrants | Iraq | 12.1 /100 | #206 | Poor $98,786 |
| Aleuts | 11.6 /100 | #207 | Poor $98,702 |
| Immigrants | Uruguay | 9.2 /100 | #208 | Tragic $98,205 |
| Immigrants | Colombia | 8.7 /100 | #209 | Tragic $98,067 |
| Puget Sound Salish | 8.2 /100 | #210 | Tragic $97,958 |
| Immigrants | Sudan | 7.4 /100 | #211 | Tragic $97,737 |
| Panamanians | 7.2 /100 | #212 | Tragic $97,683 |