Tlingit-Haida vs Hawaiian Unemployment Among Women with Children Under 18 years
COMPARE
Tlingit-Haida
Hawaiian
Unemployment Among Women with Children Under 18 years
Unemployment Among Women with Children Under 18 years Comparison
Tlingit-Haida
Hawaiians
5.4%
UNEMPLOYMENT AMONG WOMEN WITH CHILDREN UNDER 18 YEARS
61.9/ 100
METRIC RATING
165th/ 347
METRIC RANK
5.5%
UNEMPLOYMENT AMONG WOMEN WITH CHILDREN UNDER 18 YEARS
46.1/ 100
METRIC RATING
177th/ 347
METRIC RANK
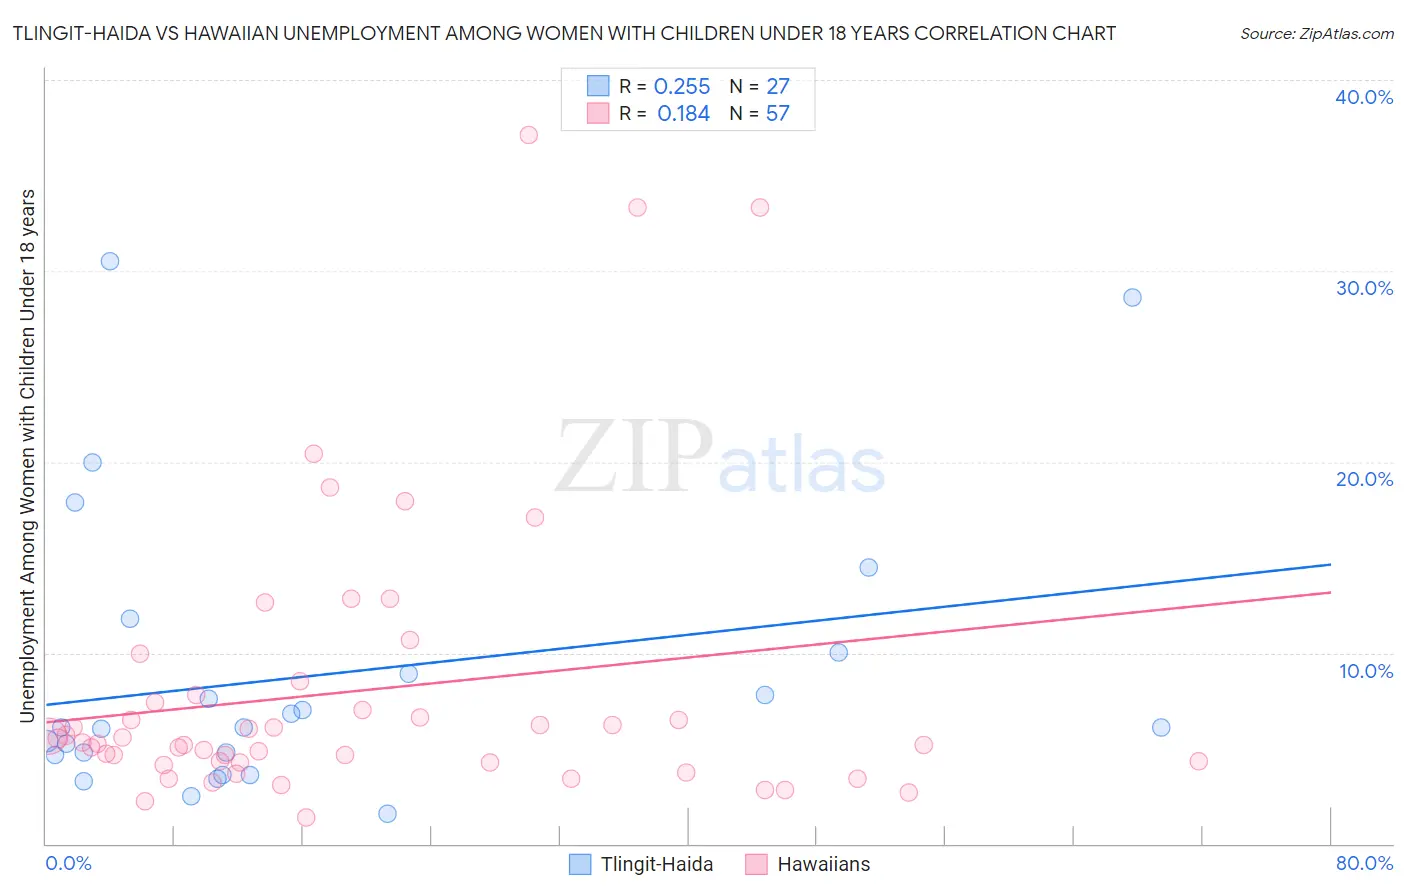
Tlingit-Haida vs Hawaiian Unemployment Among Women with Children Under 18 years Correlation Chart
The statistical analysis conducted on geographies consisting of 59,920,884 people shows a weak positive correlation between the proportion of Tlingit-Haida and unemployment rate among women with children under the age of 18 in the United States with a correlation coefficient (R) of 0.255 and weighted average of 5.4%. Similarly, the statistical analysis conducted on geographies consisting of 316,399,402 people shows a poor positive correlation between the proportion of Hawaiians and unemployment rate among women with children under the age of 18 in the United States with a correlation coefficient (R) of 0.184 and weighted average of 5.5%, a difference of 1.1%.
Unemployment Among Women with Children Under 18 years Correlation Summary
| Measurement | Tlingit-Haida | Hawaiian |
| Minimum | 1.6% | 1.4% |
| Maximum | 30.5% | 37.1% |
| Range | 28.9% | 35.7% |
| Mean | 8.8% | 8.0% |
| Median | 6.1% | 5.3% |
| Interquartile 25% (IQ1) | 4.7% | 4.2% |
| Interquartile 75% (IQ3) | 10.0% | 7.6% |
| Interquartile Range (IQR) | 5.3% | 3.4% |
| Standard Deviation (Sample) | 7.4% | 7.5% |
| Standard Deviation (Population) | 7.3% | 7.5% |
Demographics Similar to Tlingit-Haida and Hawaiians by Unemployment Among Women with Children Under 18 years
In terms of unemployment among women with children under 18 years, the demographic groups most similar to Tlingit-Haida are Celtic (5.4%, a difference of 0.090%), Aleut (5.4%, a difference of 0.19%), Lebanese (5.4%, a difference of 0.22%), Immigrants from Saudi Arabia (5.4%, a difference of 0.24%), and Immigrants from Denmark (5.4%, a difference of 0.29%). Similarly, the demographic groups most similar to Hawaiians are Costa Rican (5.5%, a difference of 0.070%), Immigrants from Germany (5.5%, a difference of 0.17%), Spanish (5.4%, a difference of 0.21%), Syrian (5.5%, a difference of 0.24%), and Immigrants from Southern Europe (5.5%, a difference of 0.24%).
| Demographics | Rating | Rank | Unemployment Among Women with Children Under 18 years |
| Immigrants | Iraq | 65.9 /100 | #161 | Good 5.4% |
| Immigrants | Saudi Arabia | 65.0 /100 | #162 | Good 5.4% |
| Lebanese | 64.7 /100 | #163 | Good 5.4% |
| Celtics | 63.0 /100 | #164 | Good 5.4% |
| Tlingit-Haida | 61.9 /100 | #165 | Good 5.4% |
| Aleuts | 59.4 /100 | #166 | Average 5.4% |
| Immigrants | Denmark | 58.0 /100 | #167 | Average 5.4% |
| Immigrants | Northern Africa | 56.1 /100 | #168 | Average 5.4% |
| Immigrants | Thailand | 55.3 /100 | #169 | Average 5.4% |
| Samoans | 54.1 /100 | #170 | Average 5.4% |
| Immigrants | Philippines | 53.1 /100 | #171 | Average 5.4% |
| Immigrants | Kazakhstan | 51.7 /100 | #172 | Average 5.4% |
| Immigrants | Eastern Africa | 51.3 /100 | #173 | Average 5.4% |
| Immigrants | Uzbekistan | 50.0 /100 | #174 | Average 5.4% |
| Spanish | 49.0 /100 | #175 | Average 5.4% |
| Immigrants | Germany | 48.5 /100 | #176 | Average 5.5% |
| Hawaiians | 46.1 /100 | #177 | Average 5.5% |
| Costa Ricans | 45.2 /100 | #178 | Average 5.5% |
| Syrians | 42.8 /100 | #179 | Average 5.5% |
| Immigrants | Southern Europe | 42.7 /100 | #180 | Average 5.5% |
| Immigrants | Hungary | 41.3 /100 | #181 | Average 5.5% |