Immigrants from Lithuania vs Bangladeshi Householder Income Under 25 years

COMPARE

Immigrants from Lithuania
Race
Ancestry
AfghanAfricanAlaska NativeAlaskan AthabascanAlbanianAleutAlsatianAmericanApacheArabArapahoArgentineanArmenianAssyrian/Chaldean/SyriacAustralianAustrianBahamianBarbadianBasqueBelgianBelizeanBermudanBhutaneseBlackfeetBolivianBrazilianBritishBritish West IndianBulgarianBurmeseCajunCambodianCanadianCape VerdeanCarpatho RusynCelticCentral AmericanCentral American IndianCherokeeCheyenneChickasawChileanChineseChippewaChoctawColombianColvilleComancheCosta RicanCreeCreekCroatianCrowCubanCypriotCzechCzechoslovakianDanishDelawareDominicanDutchDutch West IndianEastern EuropeanEcuadorianEgyptianEnglishEstonianEthiopianEuropeanFijianFilipinoFinnishFrenchFrench American IndianFrench CanadianGermanGerman RussianGhanaianGreekGuamanian/ChamorroGuatemalanGuyaneseHaitianHmongHonduranHopiHoumaHungarianIcelanderIndian (Asian)IndonesianInupiatIranianIraqiIrishIroquoisIsraeliItalianJamaicanJapaneseJordanianKenyanKiowaKoreanLaotianLatvianLebaneseLiberianLithuanianLumbeeLuxembourgerMacedonianMalaysianMalteseMarshalleseMenomineeMexicanMexican American IndianMongolianMoroccanNative HawaiianNavajoNepaleseNew ZealanderNicaraguanNigerianNorthern EuropeanNorwegianOkinawanOsageOttawaPaiutePakistaniPalestinianPanamanianParaguayanPennsylvania GermanPeruvianPimaPolishPortuguesePotawatomiPuebloPuerto RicanPuget Sound SalishRomanianRussianSalvadoranSamoanScandinavianScotch-IrishScottishSeminoleSenegaleseSerbianShoshoneSierra LeoneanSiouxSlavicSlovakSloveneSomaliSouth AfricanSouth AmericanSouth American IndianSoviet UnionSpaniardSpanishSpanish AmericanSpanish American IndianSri LankanSubsaharan AfricanSudaneseSwedishSwissSyrianTaiwaneseThaiTlingit-HaidaTohono O'OdhamTonganTrinidadian and TobagonianTsimshianTurkishU.S. Virgin IslanderUgandanUkrainianUruguayanUteVenezuelanVietnameseWelshWest IndianYakamaYaquiYugoslavianYumanYup'ikZimbabwean
Immigration
NonimmigrantsImmigrantsAfghanistanAfricaAlbaniaArgentinaArmeniaAsiaAustraliaAustriaBahamasBangladeshBarbadosBelarusBelgiumBelizeBoliviaBosnia and HerzegovinaBrazilBulgariaBurma/MyanmarCabo VerdeCambodiaCameroonCanadaCaribbeanCentral AmericaChileChinaColombiaCongoCosta RicaCroatiaCubaCzechoslovakiaDenmarkDominicaDominican RepublicEastern AfricaEastern AsiaEastern EuropeEcuadorEgyptEl SalvadorEnglandEritreaEthiopiaEuropeFijiFranceGermanyGhanaGreeceGrenadaGuatemalaGuyanaHaitiHondurasHong KongHungaryIndiaIndonesiaIranIraqIrelandIsraelItalyJamaicaJapanJordanKazakhstanKenyaKoreaKuwaitLaosLatin AmericaLatviaLebanonLiberiaLithuaniaMalaysiaMexicoMicronesiaMiddle AfricaMoldovaMoroccoNepalNetherlandsNicaraguaNigeriaNorth AmericaNorth MacedoniaNorthern AfricaNorthern EuropeNorwayOceaniaPakistanPanamaPeruPhilippinesPolandPortugalRomaniaRussiaSaudi ArabiaScotlandSenegalSerbiaSierra LeoneSingaporeSomaliaSouth AfricaSouth AmericaSouth Central AsiaSouth Eastern AsiaSouthern EuropeSpainSri LankaSt. Vincent and the GrenadinesSudanSwedenSwitzerlandSyriaTaiwanThailandTrinidad and TobagoTurkeyUgandaUkraineUruguayUzbekistanVenezuelaVietnamWest IndiesWestern AfricaWestern AsiaWestern EuropeYemenZaireZimbabweAzores
Bangladeshi
Race
Ancestry
AfghanAfricanAlaska NativeAlaskan AthabascanAlbanianAleutAlsatianAmericanApacheArabArapahoArgentineanArmenianAssyrian/Chaldean/SyriacAustralianAustrianBahamianBangladeshiBarbadianBasqueBelgianBelizeanBermudanBhutaneseBlackfeetBolivianBrazilianBritishBritish West IndianBulgarianBurmeseCajunCambodianCanadianCape VerdeanCarpatho RusynCelticCentral AmericanCentral American IndianCherokeeCheyenneChickasawChileanChineseChippewaChoctawColombianColvilleComancheCosta RicanCreeCreekCroatianCrowCubanCypriotCzechCzechoslovakianDanishDelawareDominicanDutchDutch West IndianEastern EuropeanEcuadorianEgyptianEnglishEstonianEthiopianEuropeanFijianFilipinoFinnishFrenchFrench American IndianFrench CanadianGermanGerman RussianGhanaianGreekGuamanian/ChamorroGuatemalanGuyaneseHaitianHmongHonduranHopiHoumaHungarianIcelanderIndian (Asian)IndonesianInupiatIranianIraqiIrishIroquoisIsraeliItalianJamaicanJapaneseJordanianKenyanKiowaKoreanLaotianLatvianLebaneseLiberianLithuanianLumbeeLuxembourgerMacedonianMalaysianMalteseMarshalleseMenomineeMexicanMexican American IndianMongolianMoroccanNative HawaiianNavajoNepaleseNew ZealanderNicaraguanNigerianNorthern EuropeanNorwegianOkinawanOsageOttawaPaiutePakistaniPalestinianPanamanianParaguayanPennsylvania GermanPeruvianPimaPolishPortuguesePotawatomiPuebloPuerto RicanPuget Sound SalishRomanianRussianSalvadoranSamoanScandinavianScotch-IrishScottishSeminoleSenegaleseSerbianShoshoneSierra LeoneanSiouxSlavicSlovakSloveneSomaliSouth AfricanSouth AmericanSouth American IndianSoviet UnionSpaniardSpanishSpanish AmericanSpanish American IndianSri LankanSubsaharan AfricanSudaneseSwedishSwissSyrianTaiwaneseThaiTlingit-HaidaTohono O'OdhamTonganTrinidadian and TobagonianTsimshianTurkishU.S. Virgin IslanderUgandanUkrainianUruguayanUteVenezuelanVietnameseWelshWest IndianYakamaYaquiYugoslavianYumanYup'ikZimbabwean
Immigration
NonimmigrantsImmigrantsAfghanistanAfricaAlbaniaArgentinaArmeniaAsiaAustraliaAustriaBahamasBangladeshBarbadosBelarusBelgiumBelizeBoliviaBosnia and HerzegovinaBrazilBulgariaBurma/MyanmarCabo VerdeCambodiaCameroonCanadaCaribbeanCentral AmericaChileChinaColombiaCongoCosta RicaCroatiaCubaCzechoslovakiaDenmarkDominicaDominican RepublicEastern AfricaEastern AsiaEastern EuropeEcuadorEgyptEl SalvadorEnglandEritreaEthiopiaEuropeFijiFranceGermanyGhanaGreeceGrenadaGuatemalaGuyanaHaitiHondurasHong KongHungaryIndiaIndonesiaIranIraqIrelandIsraelItalyJamaicaJapanJordanKazakhstanKenyaKoreaKuwaitLaosLatin AmericaLatviaLebanonLiberiaMalaysiaMexicoMicronesiaMiddle AfricaMoldovaMoroccoNepalNetherlandsNicaraguaNigeriaNorth AmericaNorth MacedoniaNorthern AfricaNorthern EuropeNorwayOceaniaPakistanPanamaPeruPhilippinesPolandPortugalRomaniaRussiaSaudi ArabiaScotlandSenegalSerbiaSierra LeoneSingaporeSomaliaSouth AfricaSouth AmericaSouth Central AsiaSouth Eastern AsiaSouthern EuropeSpainSri LankaSt. Vincent and the GrenadinesSudanSwedenSwitzerlandSyriaTaiwanThailandTrinidad and TobagoTurkeyUgandaUkraineUruguayUzbekistanVenezuelaVietnamWest IndiesWestern AfricaWestern AsiaWestern EuropeYemenZaireZimbabweAzores
Householder Income Under 25 years
Income
Poverty
Unemployment
Labor Participation
Family Structure
Vehicle Availability
Education Level
Disability

Householder Income Under 25 years Comparison

Immigrants from Lithuania

Bangladeshis

Exceptional
Tragic
$55,028
HOUSEHOLDER INCOME UNDER 25 YEARS
99.9/ 100
METRIC RATING
60th/ 347
METRIC RANK
$47,589
HOUSEHOLDER INCOME UNDER 25 YEARS
0.0/ 100
METRIC RATING
307th/ 347
METRIC RANK

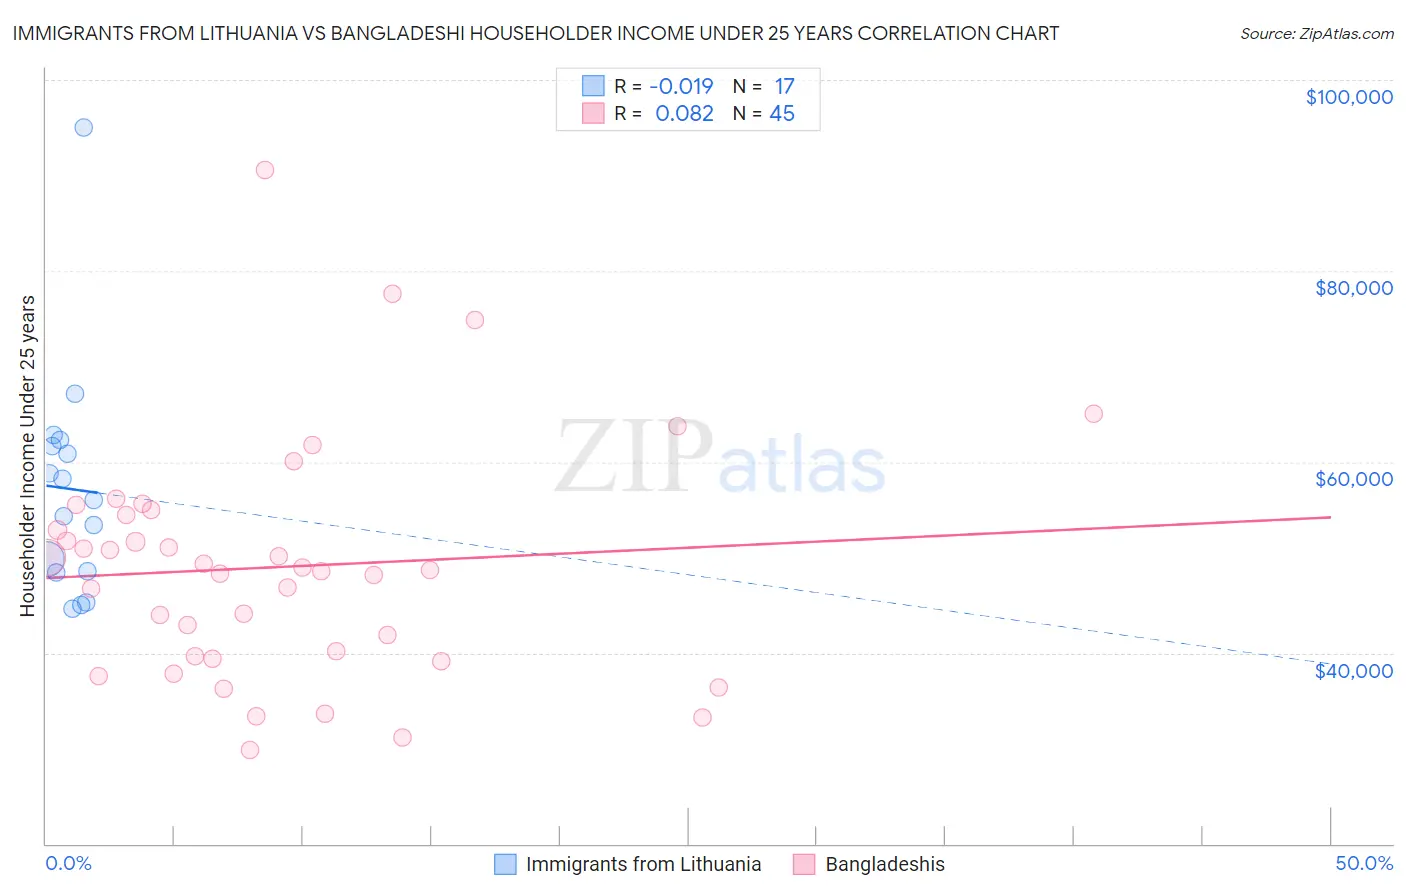
Immigrants from Lithuania vs Bangladeshi Householder Income Under 25 years Correlation Chart

The statistical analysis conducted on geographies consisting of 105,974,448 people shows no correlation between the proportion of Immigrants from Lithuania and household income with householder under the age of 25 in the United States with a correlation coefficient (R) of -0.019 and weighted average of $55,028. Similarly, the statistical analysis conducted on geographies consisting of 131,389,647 people shows a slight positive correlation between the proportion of Bangladeshis and household income with householder under the age of 25 in the United States with a correlation coefficient (R) of 0.082 and weighted average of $47,589, a difference of 15.6%.
Immigrants from Lithuania vs Bangladeshi Householder Income Under 25 years

Householder Income Under 25 years Correlation Summary

MeasurementImmigrants from LithuaniaBangladeshi
Minimum$44,601$29,883
Maximum$94,977$90,583
Range$50,376$60,700
Mean$57,170$49,001
Median$56,042$48,654
Interquartile 25% (IQ1)$48,432$39,531
Interquartile 75% (IQ3)$61,949$54,671
Interquartile Range (IQR)$13,518$15,140
Standard Deviation (Sample)$11,998$12,360
Standard Deviation (Population)$11,640$12,222

Similar Demographics by Householder Income Under 25 years

Demographics Similar to Immigrants from Lithuania by Householder Income Under 25 years

In terms of householder income under 25 years, the demographic groups most similar to Immigrants from Lithuania are Immigrants from Europe ($55,022, a difference of 0.010%), Native Hawaiian ($55,158, a difference of 0.24%), Guyanese ($55,210, a difference of 0.33%), Immigrants from Uzbekistan ($54,846, a difference of 0.33%), and Immigrants from Belgium ($54,830, a difference of 0.36%).
DemographicsRating | RankHouseholder Income Under 25 years
Immigrants | Poland
100.0
/100
|
#53
Exceptional
$55,474
Sri Lankans
100.0
/100
|
#54
Exceptional
$55,470
Immigrants | Ukraine
100.0
/100
|
#55
Exceptional
$55,447
Salvadorans
100.0
/100
|
#56
Exceptional
$55,412
Soviet Union
100.0
/100
|
#57
Exceptional
$55,340
Guyanese
99.9
/100
|
#58
Exceptional
$55,210
Native Hawaiians
99.9
/100
|
#59
Exceptional
$55,158
Immigrants | Lithuania
99.9
/100
|
#60
Exceptional
$55,028
Immigrants | Europe
99.9
/100
|
#61
Exceptional
$55,022
Immigrants | Uzbekistan
99.8
/100
|
#62
Exceptional
$54,846
Immigrants | Belgium
99.8
/100
|
#63
Exceptional
$54,830
Burmese
99.8
/100
|
#64
Exceptional
$54,800
Yup'ik
99.8
/100
|
#65
Exceptional
$54,732
Immigrants | Bangladesh
99.8
/100
|
#66
Exceptional
$54,714
Okinawans
99.8
/100
|
#67
Exceptional
$54,701

Demographics Similar to Bangladeshis by Householder Income Under 25 years

In terms of householder income under 25 years, the demographic groups most similar to Bangladeshis are Comanche ($47,518, a difference of 0.15%), Native/Alaskan ($47,704, a difference of 0.24%), U.S. Virgin Islander ($47,448, a difference of 0.30%), Iroquois ($47,380, a difference of 0.44%), and Ottawa ($47,366, a difference of 0.47%).
DemographicsRating | RankHouseholder Income Under 25 years
Immigrants | Somalia
0.0
/100
|
#300
Tragic
$48,135
Immigrants | Kuwait
0.0
/100
|
#301
Tragic
$48,126
Immigrants | Liberia
0.0
/100
|
#302
Tragic
$47,981
Immigrants | Middle Africa
0.0
/100
|
#303
Tragic
$47,916
Menominee
0.0
/100
|
#304
Tragic
$47,907
Cherokee
0.0
/100
|
#305
Tragic
$47,848
Natives/Alaskans
0.0
/100
|
#306
Tragic
$47,704
Bangladeshis
0.0
/100
|
#307
Tragic
$47,589
Comanche
0.0
/100
|
#308
Tragic
$47,518
U.S. Virgin Islanders
0.0
/100
|
#309
Tragic
$47,448
Iroquois
0.0
/100
|
#310
Tragic
$47,380
Ottawa
0.0
/100
|
#311
Tragic
$47,366
Bermudans
0.0
/100
|
#312
Tragic
$47,359
Delaware
0.0
/100
|
#313
Tragic
$47,159
Chippewa
0.0
/100
|
#314
Tragic
$47,015