Syrian vs Immigrants from Chile Male Poverty
COMPARE
Syrian
Immigrants from Chile
Male Poverty
Male Poverty Comparison
Syrians
Immigrants from Chile
10.9%
MALE POVERTY
71.4/ 100
METRIC RATING
146th/ 347
METRIC RANK
11.1%
MALE POVERTY
57.4/ 100
METRIC RATING
162nd/ 347
METRIC RANK
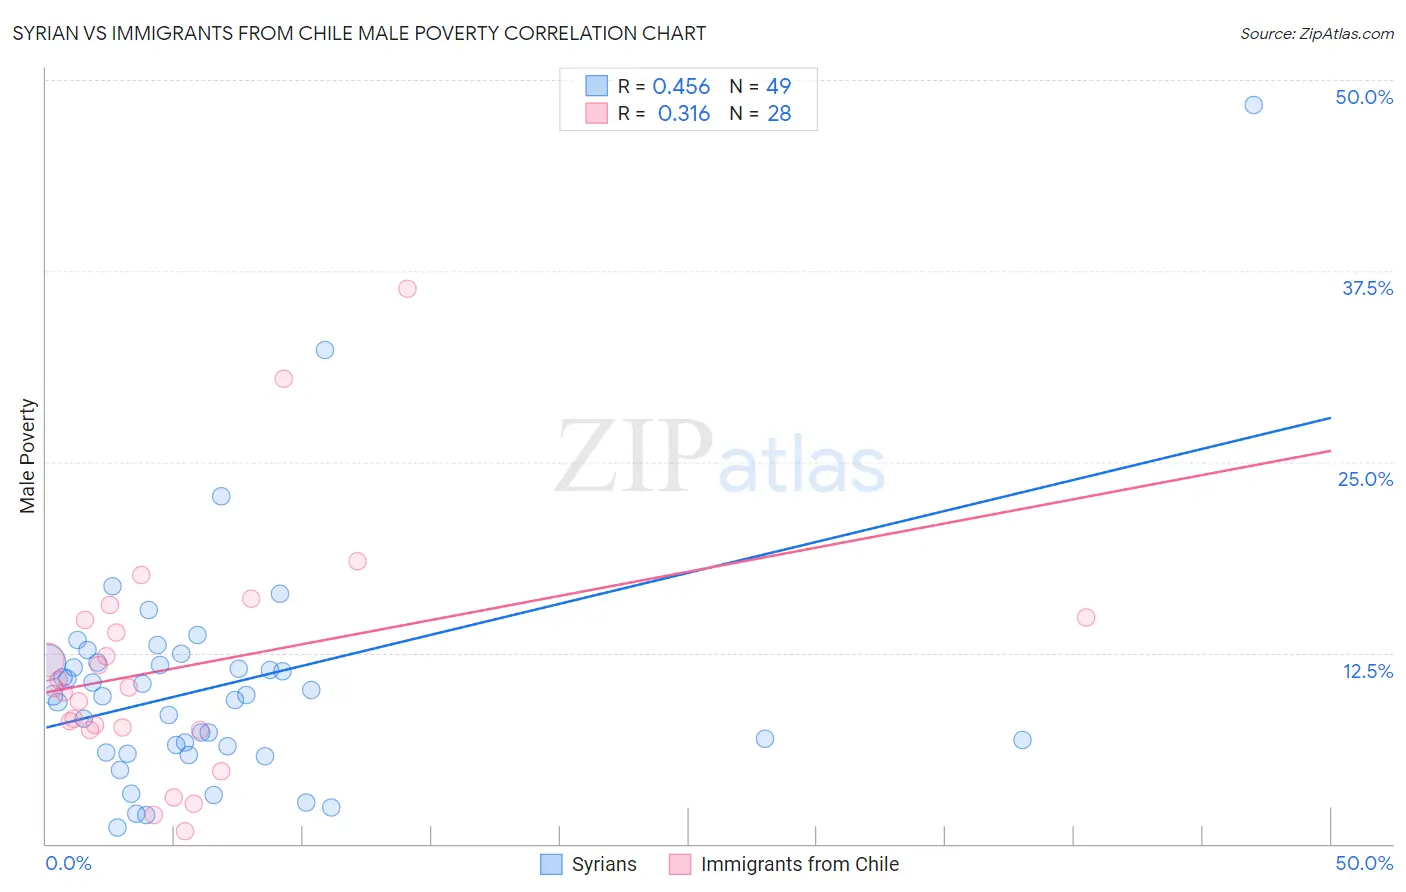
Syrian vs Immigrants from Chile Male Poverty Correlation Chart
The statistical analysis conducted on geographies consisting of 266,155,974 people shows a moderate positive correlation between the proportion of Syrians and poverty level among males in the United States with a correlation coefficient (R) of 0.456 and weighted average of 10.9%. Similarly, the statistical analysis conducted on geographies consisting of 218,566,097 people shows a mild positive correlation between the proportion of Immigrants from Chile and poverty level among males in the United States with a correlation coefficient (R) of 0.316 and weighted average of 11.1%, a difference of 1.5%.
Male Poverty Correlation Summary
| Measurement | Syrian | Immigrants from Chile |
| Minimum | 1.0% | 0.80% |
| Maximum | 48.3% | 36.4% |
| Range | 47.3% | 35.6% |
| Mean | 10.4% | 11.6% |
| Median | 9.7% | 10.2% |
| Interquartile 25% (IQ1) | 6.2% | 7.5% |
| Interquartile 75% (IQ3) | 11.8% | 14.8% |
| Interquartile Range (IQR) | 5.7% | 7.2% |
| Standard Deviation (Sample) | 7.8% | 7.8% |
| Standard Deviation (Population) | 7.7% | 7.6% |
Demographics Similar to Syrians and Immigrants from Chile by Male Poverty
In terms of male poverty, the demographic groups most similar to Syrians are Immigrants from Germany (10.9%, a difference of 0.030%), Samoan (10.9%, a difference of 0.050%), Icelander (11.0%, a difference of 0.34%), Armenian (11.0%, a difference of 0.40%), and Immigrants from Venezuela (11.0%, a difference of 0.41%). Similarly, the demographic groups most similar to Immigrants from Chile are White/Caucasian (11.1%, a difference of 0.060%), Ethiopian (11.1%, a difference of 0.070%), Immigrants from Northern Africa (11.1%, a difference of 0.23%), Soviet Union (11.1%, a difference of 0.30%), and Taiwanese (11.0%, a difference of 0.55%).
| Demographics | Rating | Rank | Male Poverty |
| Samoans | 71.8 /100 | #144 | Good 10.9% |
| Immigrants | Germany | 71.6 /100 | #145 | Good 10.9% |
| Syrians | 71.4 /100 | #146 | Good 10.9% |
| Icelanders | 68.5 /100 | #147 | Good 11.0% |
| Armenians | 68.0 /100 | #148 | Good 11.0% |
| Immigrants | Venezuela | 67.9 /100 | #149 | Good 11.0% |
| Guamanians/Chamorros | 67.6 /100 | #150 | Good 11.0% |
| Venezuelans | 67.4 /100 | #151 | Good 11.0% |
| Immigrants | Nepal | 67.3 /100 | #152 | Good 11.0% |
| Immigrants | Bosnia and Herzegovina | 65.2 /100 | #153 | Good 11.0% |
| Immigrants | Kazakhstan | 64.8 /100 | #154 | Good 11.0% |
| Immigrants | Malaysia | 64.7 /100 | #155 | Good 11.0% |
| Costa Ricans | 63.9 /100 | #156 | Good 11.0% |
| Scotch-Irish | 63.7 /100 | #157 | Good 11.0% |
| Colombians | 63.0 /100 | #158 | Good 11.0% |
| Taiwanese | 62.7 /100 | #159 | Good 11.0% |
| Soviet Union | 60.3 /100 | #160 | Good 11.1% |
| Immigrants | Northern Africa | 59.7 /100 | #161 | Average 11.1% |
| Immigrants | Chile | 57.4 /100 | #162 | Average 11.1% |
| Whites/Caucasians | 56.7 /100 | #163 | Average 11.1% |
| Ethiopians | 56.7 /100 | #164 | Average 11.1% |