Immigrants from Belgium vs Immigrants from Chile Median Female Earnings

COMPARE

Immigrants from Belgium
Race
Ancestry
AfghanAfricanAlaska NativeAlaskan AthabascanAlbanianAleutAlsatianAmericanApacheArabArapahoArgentineanArmenianAssyrian/Chaldean/SyriacAustralianAustrianBahamianBangladeshiBarbadianBasqueBelgianBelizeanBermudanBhutaneseBlackfeetBolivianBrazilianBritishBritish West IndianBulgarianBurmeseCajunCambodianCanadianCape VerdeanCarpatho RusynCelticCentral AmericanCentral American IndianCherokeeCheyenneChickasawChileanChineseChippewaChoctawColombianColvilleComancheCosta RicanCreeCreekCroatianCrowCubanCypriotCzechCzechoslovakianDanishDelawareDominicanDutchDutch West IndianEastern EuropeanEcuadorianEgyptianEnglishEstonianEthiopianEuropeanFijianFilipinoFinnishFrenchFrench American IndianFrench CanadianGermanGerman RussianGhanaianGreekGuamanian/ChamorroGuatemalanGuyaneseHaitianHmongHonduranHopiHoumaHungarianIcelanderIndian (Asian)IndonesianInupiatIranianIraqiIrishIroquoisIsraeliItalianJamaicanJapaneseJordanianKenyanKiowaKoreanLaotianLatvianLebaneseLiberianLithuanianLumbeeLuxembourgerMacedonianMalaysianMalteseMarshalleseMenomineeMexicanMexican American IndianMongolianMoroccanNative HawaiianNavajoNepaleseNew ZealanderNicaraguanNigerianNorthern EuropeanNorwegianOkinawanOsageOttawaPaiutePakistaniPalestinianPanamanianParaguayanPennsylvania GermanPeruvianPimaPolishPortuguesePotawatomiPuebloPuerto RicanPuget Sound SalishRomanianRussianSalvadoranSamoanScandinavianScotch-IrishScottishSeminoleSenegaleseSerbianShoshoneSierra LeoneanSiouxSlavicSlovakSloveneSomaliSouth AfricanSouth AmericanSouth American IndianSoviet UnionSpaniardSpanishSpanish AmericanSpanish American IndianSri LankanSubsaharan AfricanSudaneseSwedishSwissSyrianTaiwaneseThaiTlingit-HaidaTohono O'OdhamTonganTrinidadian and TobagonianTsimshianTurkishU.S. Virgin IslanderUgandanUkrainianUruguayanUteVenezuelanVietnameseWelshWest IndianYakamaYaquiYugoslavianYumanYup'ikZimbabwean
Immigration
NonimmigrantsImmigrantsAfghanistanAfricaAlbaniaArgentinaArmeniaAsiaAustraliaAustriaBahamasBangladeshBarbadosBelarusBelgiumBelizeBoliviaBosnia and HerzegovinaBrazilBulgariaBurma/MyanmarCabo VerdeCambodiaCameroonCanadaCaribbeanCentral AmericaChinaColombiaCongoCosta RicaCroatiaCubaCzechoslovakiaDenmarkDominicaDominican RepublicEastern AfricaEastern AsiaEastern EuropeEcuadorEgyptEl SalvadorEnglandEritreaEthiopiaEuropeFijiFranceGermanyGhanaGreeceGrenadaGuatemalaGuyanaHaitiHondurasHong KongHungaryIndiaIndonesiaIranIraqIrelandIsraelItalyJamaicaJapanJordanKazakhstanKenyaKoreaKuwaitLaosLatin AmericaLatviaLebanonLiberiaLithuaniaMalaysiaMexicoMicronesiaMiddle AfricaMoldovaMoroccoNepalNetherlandsNicaraguaNigeriaNorth AmericaNorth MacedoniaNorthern AfricaNorthern EuropeNorwayOceaniaPakistanPanamaPeruPhilippinesPolandPortugalRomaniaRussiaSaudi ArabiaScotlandSenegalSerbiaSierra LeoneSingaporeSomaliaSouth AfricaSouth AmericaSouth Central AsiaSouth Eastern AsiaSouthern EuropeSpainSri LankaSt. Vincent and the GrenadinesSudanSwedenSwitzerlandSyriaTaiwanThailandTrinidad and TobagoTurkeyUgandaUkraineUruguayUzbekistanVenezuelaVietnamWest IndiesWestern AfricaWestern AsiaWestern EuropeYemenZaireZimbabweAzores
Immigrants from Chile
Race
Ancestry
AfghanAfricanAlaska NativeAlaskan AthabascanAlbanianAleutAlsatianAmericanApacheArabArapahoArgentineanArmenianAssyrian/Chaldean/SyriacAustralianAustrianBahamianBangladeshiBarbadianBasqueBelgianBelizeanBermudanBhutaneseBlackfeetBolivianBrazilianBritishBritish West IndianBulgarianBurmeseCajunCambodianCanadianCape VerdeanCarpatho RusynCelticCentral AmericanCentral American IndianCherokeeCheyenneChickasawChileanChineseChippewaChoctawColombianColvilleComancheCosta RicanCreeCreekCroatianCrowCubanCypriotCzechCzechoslovakianDanishDelawareDominicanDutchDutch West IndianEastern EuropeanEcuadorianEgyptianEnglishEstonianEthiopianEuropeanFijianFilipinoFinnishFrenchFrench American IndianFrench CanadianGermanGerman RussianGhanaianGreekGuamanian/ChamorroGuatemalanGuyaneseHaitianHmongHonduranHopiHoumaHungarianIcelanderIndian (Asian)IndonesianInupiatIranianIraqiIrishIroquoisIsraeliItalianJamaicanJapaneseJordanianKenyanKiowaKoreanLaotianLatvianLebaneseLiberianLithuanianLumbeeLuxembourgerMacedonianMalaysianMalteseMarshalleseMenomineeMexicanMexican American IndianMongolianMoroccanNative HawaiianNavajoNepaleseNew ZealanderNicaraguanNigerianNorthern EuropeanNorwegianOkinawanOsageOttawaPaiutePakistaniPalestinianPanamanianParaguayanPennsylvania GermanPeruvianPimaPolishPortuguesePotawatomiPuebloPuerto RicanPuget Sound SalishRomanianRussianSalvadoranSamoanScandinavianScotch-IrishScottishSeminoleSenegaleseSerbianShoshoneSierra LeoneanSiouxSlavicSlovakSloveneSomaliSouth AfricanSouth AmericanSouth American IndianSoviet UnionSpaniardSpanishSpanish AmericanSpanish American IndianSri LankanSubsaharan AfricanSudaneseSwedishSwissSyrianTaiwaneseThaiTlingit-HaidaTohono O'OdhamTonganTrinidadian and TobagonianTsimshianTurkishU.S. Virgin IslanderUgandanUkrainianUruguayanUteVenezuelanVietnameseWelshWest IndianYakamaYaquiYugoslavianYumanYup'ikZimbabwean
Immigration
NonimmigrantsImmigrantsAfghanistanAfricaAlbaniaArgentinaArmeniaAsiaAustraliaAustriaBahamasBangladeshBarbadosBelarusBelizeBoliviaBosnia and HerzegovinaBrazilBulgariaBurma/MyanmarCabo VerdeCambodiaCameroonCanadaCaribbeanCentral AmericaChileChinaColombiaCongoCosta RicaCroatiaCubaCzechoslovakiaDenmarkDominicaDominican RepublicEastern AfricaEastern AsiaEastern EuropeEcuadorEgyptEl SalvadorEnglandEritreaEthiopiaEuropeFijiFranceGermanyGhanaGreeceGrenadaGuatemalaGuyanaHaitiHondurasHong KongHungaryIndiaIndonesiaIranIraqIrelandIsraelItalyJamaicaJapanJordanKazakhstanKenyaKoreaKuwaitLaosLatin AmericaLatviaLebanonLiberiaLithuaniaMalaysiaMexicoMicronesiaMiddle AfricaMoldovaMoroccoNepalNetherlandsNicaraguaNigeriaNorth AmericaNorth MacedoniaNorthern AfricaNorthern EuropeNorwayOceaniaPakistanPanamaPeruPhilippinesPolandPortugalRomaniaRussiaSaudi ArabiaScotlandSenegalSerbiaSierra LeoneSingaporeSomaliaSouth AfricaSouth AmericaSouth Central AsiaSouth Eastern AsiaSouthern EuropeSpainSri LankaSt. Vincent and the GrenadinesSudanSwedenSwitzerlandSyriaTaiwanThailandTrinidad and TobagoTurkeyUgandaUkraineUruguayUzbekistanVenezuelaVietnamWest IndiesWestern AfricaWestern AsiaWestern EuropeYemenZaireZimbabweAzores
Median Female Earnings
Income
Poverty
Unemployment
Labor Participation
Family Structure
Vehicle Availability
Education Level
Disability

Median Female Earnings Comparison

Immigrants from Belgium

Immigrants from Chile

Exceptional
Good
$44,587
MEDIAN FEMALE EARNINGS
100.0/ 100
METRIC RATING
29th/ 347
METRIC RANK
$40,353
MEDIAN FEMALE EARNINGS
79.6/ 100
METRIC RATING
150th/ 347
METRIC RANK

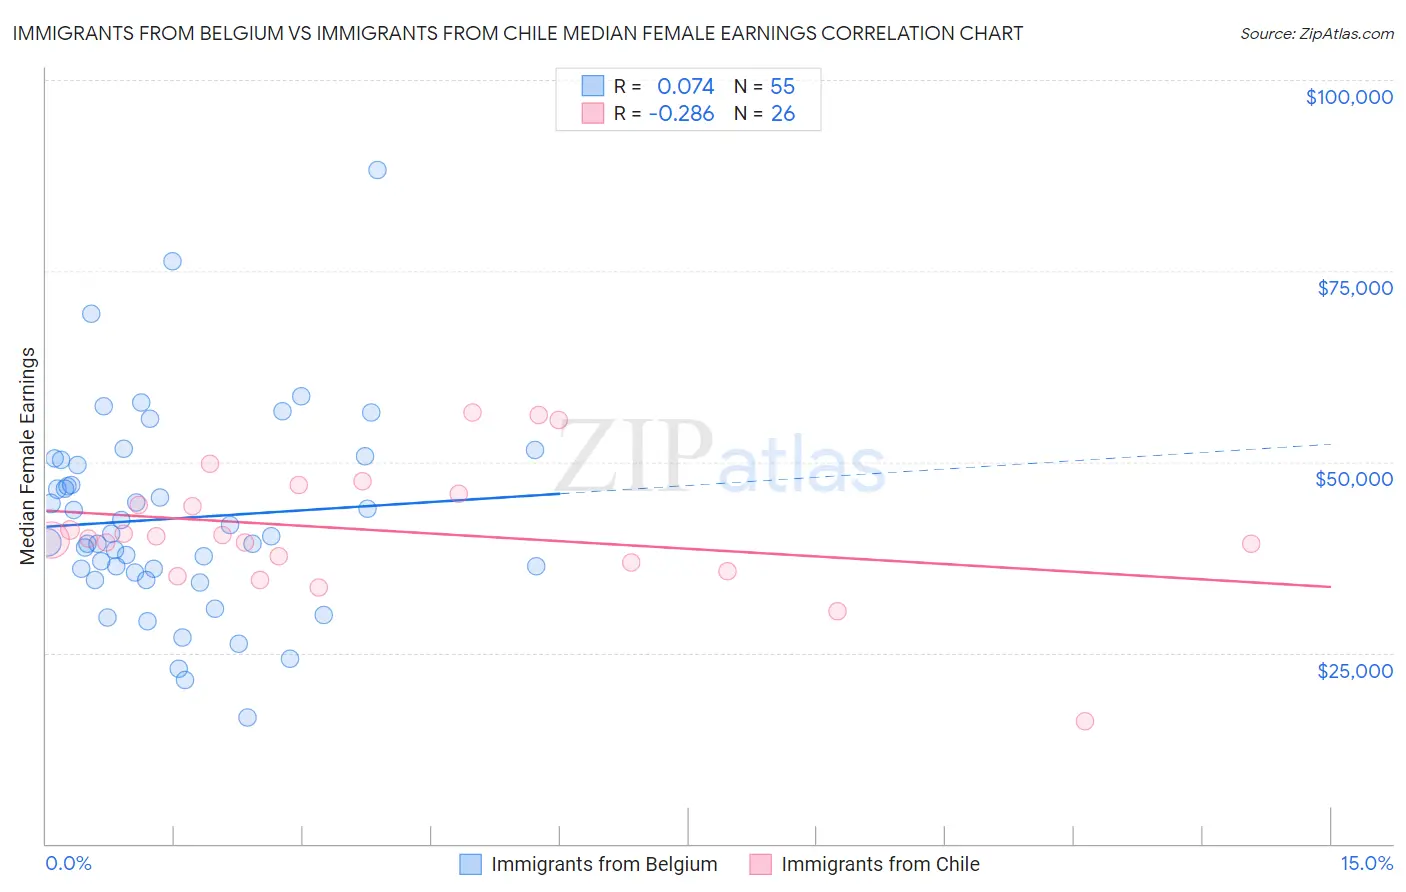
Immigrants from Belgium vs Immigrants from Chile Median Female Earnings Correlation Chart

The statistical analysis conducted on geographies consisting of 146,688,407 people shows a slight positive correlation between the proportion of Immigrants from Belgium and median female earnings in the United States with a correlation coefficient (R) of 0.074 and weighted average of $44,587. Similarly, the statistical analysis conducted on geographies consisting of 218,612,520 people shows a weak negative correlation between the proportion of Immigrants from Chile and median female earnings in the United States with a correlation coefficient (R) of -0.286 and weighted average of $40,353, a difference of 10.5%.
Immigrants from Belgium vs Immigrants from Chile Median Female Earnings

Median Female Earnings Correlation Summary

MeasurementImmigrants from BelgiumImmigrants from Chile
Minimum$16,513$16,042
Maximum$88,194$56,442
Range$71,681$40,400
Mean$42,604$41,031
Median$40,333$40,109
Interquartile 25% (IQ1)$35,589$36,875
Interquartile 75% (IQ3)$50,235$45,789
Interquartile Range (IQR)$14,647$8,914
Standard Deviation (Sample)$13,110$8,520
Standard Deviation (Population)$12,990$8,355

Similar Demographics by Median Female Earnings

Demographics Similar to Immigrants from Belgium by Median Female Earnings

In terms of median female earnings, the demographic groups most similar to Immigrants from Belgium are Asian ($44,586, a difference of 0.0%), Immigrants from France ($44,541, a difference of 0.10%), Immigrants from Russia ($44,680, a difference of 0.21%), Turkish ($44,695, a difference of 0.24%), and Immigrants from Belarus ($44,757, a difference of 0.38%).
DemographicsRating | RankMedian Female Earnings
Immigrants | Greece
100.0
/100
|
#22
Exceptional
$44,976
Burmese
100.0
/100
|
#23
Exceptional
$44,911
Immigrants | Korea
100.0
/100
|
#24
Exceptional
$44,847
Immigrants | Sweden
100.0
/100
|
#25
Exceptional
$44,774
Immigrants | Belarus
100.0
/100
|
#26
Exceptional
$44,757
Turks
100.0
/100
|
#27
Exceptional
$44,695
Immigrants | Russia
100.0
/100
|
#28
Exceptional
$44,680
Immigrants | Belgium
100.0
/100
|
#29
Exceptional
$44,587
Asians
100.0
/100
|
#30
Exceptional
$44,586
Immigrants | France
100.0
/100
|
#31
Exceptional
$44,541
Immigrants | Northern Europe
100.0
/100
|
#32
Exceptional
$44,366
Immigrants | Asia
100.0
/100
|
#33
Exceptional
$44,198
Russians
100.0
/100
|
#34
Exceptional
$44,169
Immigrants | Sri Lanka
100.0
/100
|
#35
Exceptional
$44,161
Immigrants | Turkey
100.0
/100
|
#36
Exceptional
$44,066

Demographics Similar to Immigrants from Chile by Median Female Earnings

In terms of median female earnings, the demographic groups most similar to Immigrants from Chile are Immigrants from Cameroon ($40,354, a difference of 0.0%), Immigrants from Armenia ($40,340, a difference of 0.030%), Polish ($40,371, a difference of 0.040%), Vietnamese ($40,377, a difference of 0.060%), and West Indian ($40,317, a difference of 0.090%).
DemographicsRating | RankMedian Female Earnings
Northern Europeans
83.9
/100
|
#143
Excellent
$40,491
Immigrants | North Macedonia
83.8
/100
|
#144
Excellent
$40,488
Brazilians
83.6
/100
|
#145
Excellent
$40,483
Ghanaians
82.1
/100
|
#146
Excellent
$40,429
Vietnamese
80.4
/100
|
#147
Excellent
$40,377
Poles
80.2
/100
|
#148
Excellent
$40,371
Immigrants | Cameroon
79.7
/100
|
#149
Good
$40,354
Immigrants | Chile
79.6
/100
|
#150
Good
$40,353
Immigrants | Armenia
79.2
/100
|
#151
Good
$40,340
West Indians
78.4
/100
|
#152
Good
$40,317
British West Indians
77.7
/100
|
#153
Good
$40,299
Immigrants | Oceania
77.6
/100
|
#154
Good
$40,297
Immigrants | Africa
76.2
/100
|
#155
Good
$40,257
Peruvians
75.3
/100
|
#156
Good
$40,234
Portuguese
73.0
/100
|
#157
Good
$40,177