Immigrants from Latin America vs Immigrants from Africa Median Female Earnings
COMPARE
Immigrants from Latin America
Immigrants from Africa
Median Female Earnings
Median Female Earnings Comparison
Immigrants from Latin America
Immigrants from Africa
$35,307
MEDIAN FEMALE EARNINGS
0.0/ 100
METRIC RATING
303rd/ 347
METRIC RANK
$40,257
MEDIAN FEMALE EARNINGS
76.2/ 100
METRIC RATING
155th/ 347
METRIC RANK
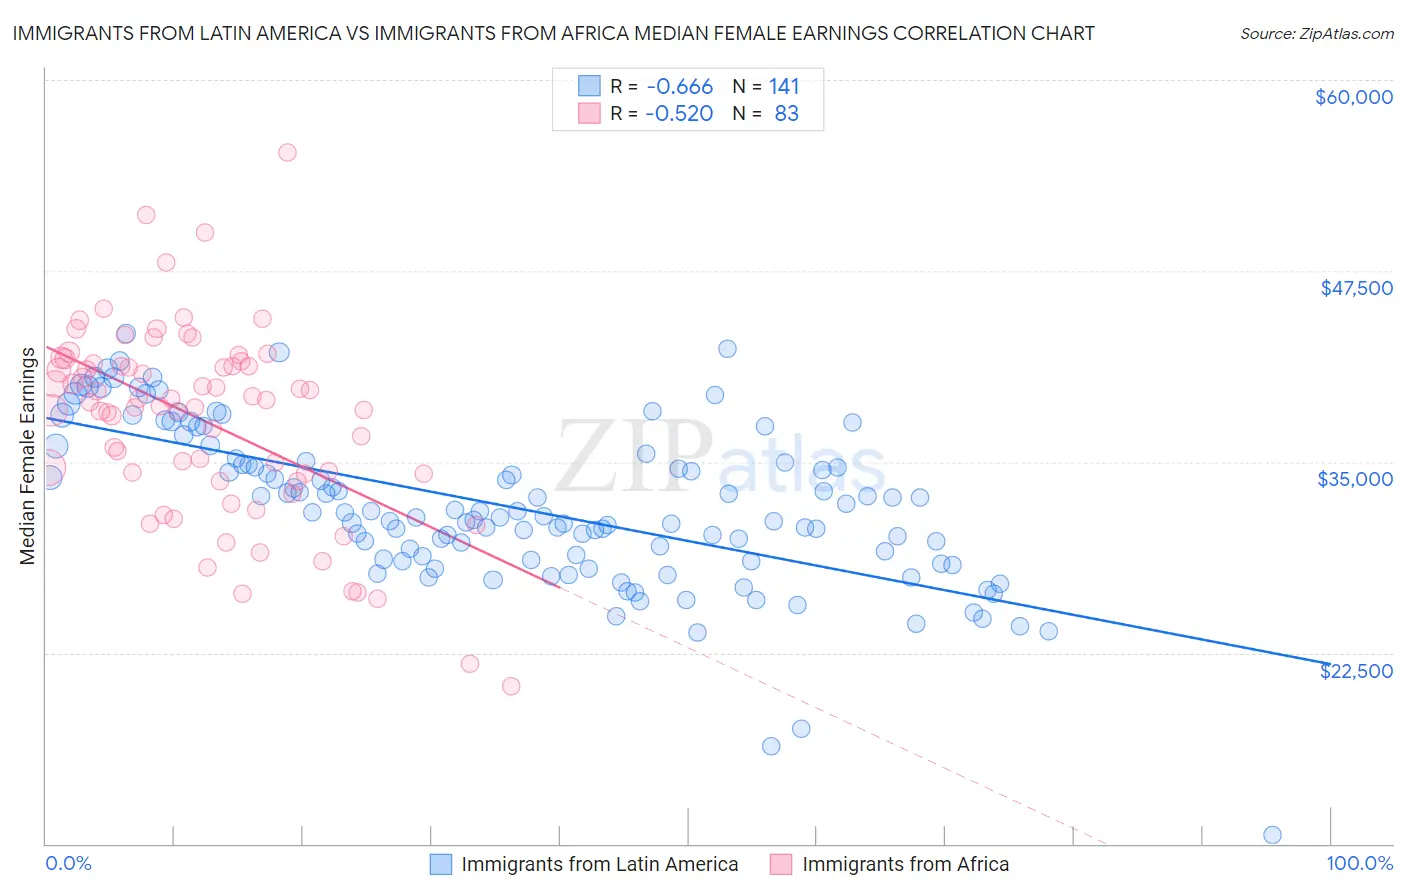
Immigrants from Latin America vs Immigrants from Africa Median Female Earnings Correlation Chart
The statistical analysis conducted on geographies consisting of 557,242,268 people shows a significant negative correlation between the proportion of Immigrants from Latin America and median female earnings in the United States with a correlation coefficient (R) of -0.666 and weighted average of $35,307. Similarly, the statistical analysis conducted on geographies consisting of 469,175,130 people shows a substantial negative correlation between the proportion of Immigrants from Africa and median female earnings in the United States with a correlation coefficient (R) of -0.520 and weighted average of $40,257, a difference of 14.0%.
Median Female Earnings Correlation Summary
| Measurement | Immigrants from Latin America | Immigrants from Africa |
| Minimum | $10,532 | $20,281 |
| Maximum | $43,408 | $55,224 |
| Range | $32,876 | $34,943 |
| Mean | $32,057 | $37,710 |
| Median | $31,685 | $38,916 |
| Interquartile 25% (IQ1) | $28,590 | $34,205 |
| Interquartile 75% (IQ3) | $35,130 | $41,443 |
| Interquartile Range (IQR) | $6,540 | $7,238 |
| Standard Deviation (Sample) | $5,280 | $6,266 |
| Standard Deviation (Population) | $5,261 | $6,228 |
Similar Demographics by Median Female Earnings
Demographics Similar to Immigrants from Latin America by Median Female Earnings
In terms of median female earnings, the demographic groups most similar to Immigrants from Latin America are Black/African American ($35,315, a difference of 0.020%), Pima ($35,326, a difference of 0.050%), Crow ($35,266, a difference of 0.11%), Yuman ($35,377, a difference of 0.20%), and Immigrants from Guatemala ($35,444, a difference of 0.39%).
| Demographics | Rating | Rank | Median Female Earnings |
| Mexican American Indians | 0.0 /100 | #296 | Tragic $35,629 |
| Hmong | 0.0 /100 | #297 | Tragic $35,498 |
| Immigrants | Micronesia | 0.0 /100 | #298 | Tragic $35,477 |
| Immigrants | Guatemala | 0.0 /100 | #299 | Tragic $35,444 |
| Yuman | 0.0 /100 | #300 | Tragic $35,377 |
| Pima | 0.0 /100 | #301 | Tragic $35,326 |
| Blacks/African Americans | 0.0 /100 | #302 | Tragic $35,315 |
| Immigrants | Latin America | 0.0 /100 | #303 | Tragic $35,307 |
| Crow | 0.0 /100 | #304 | Tragic $35,266 |
| Bahamians | 0.0 /100 | #305 | Tragic $35,125 |
| Fijians | 0.0 /100 | #306 | Tragic $35,114 |
| Sioux | 0.0 /100 | #307 | Tragic $35,063 |
| Immigrants | Bahamas | 0.0 /100 | #308 | Tragic $35,027 |
| Hondurans | 0.0 /100 | #309 | Tragic $35,013 |
| Chippewa | 0.0 /100 | #310 | Tragic $35,003 |
Demographics Similar to Immigrants from Africa by Median Female Earnings
In terms of median female earnings, the demographic groups most similar to Immigrants from Africa are Peruvian ($40,234, a difference of 0.060%), British West Indian ($40,299, a difference of 0.10%), Immigrants from Oceania ($40,297, a difference of 0.10%), West Indian ($40,317, a difference of 0.15%), and Portuguese ($40,177, a difference of 0.20%).
| Demographics | Rating | Rank | Median Female Earnings |
| Poles | 80.2 /100 | #148 | Excellent $40,371 |
| Immigrants | Cameroon | 79.7 /100 | #149 | Good $40,354 |
| Immigrants | Chile | 79.6 /100 | #150 | Good $40,353 |
| Immigrants | Armenia | 79.2 /100 | #151 | Good $40,340 |
| West Indians | 78.4 /100 | #152 | Good $40,317 |
| British West Indians | 77.7 /100 | #153 | Good $40,299 |
| Immigrants | Oceania | 77.6 /100 | #154 | Good $40,297 |
| Immigrants | Africa | 76.2 /100 | #155 | Good $40,257 |
| Peruvians | 75.3 /100 | #156 | Good $40,234 |
| Portuguese | 73.0 /100 | #157 | Good $40,177 |
| Immigrants | Senegal | 72.2 /100 | #158 | Good $40,157 |
| Immigrants | Vietnam | 72.0 /100 | #159 | Good $40,153 |
| Inupiat | 68.9 /100 | #160 | Good $40,080 |
| Alsatians | 68.0 /100 | #161 | Good $40,060 |
| South American Indians | 66.1 /100 | #162 | Good $40,019 |