Immigrants from South America vs Immigrants from Africa Median Female Earnings
COMPARE
Immigrants from South America
Immigrants from Africa
Median Female Earnings
Median Female Earnings Comparison
Immigrants from South America
Immigrants from Africa
$39,643
MEDIAN FEMALE EARNINGS
47.2/ 100
METRIC RATING
175th/ 347
METRIC RANK
$40,257
MEDIAN FEMALE EARNINGS
76.2/ 100
METRIC RATING
155th/ 347
METRIC RANK
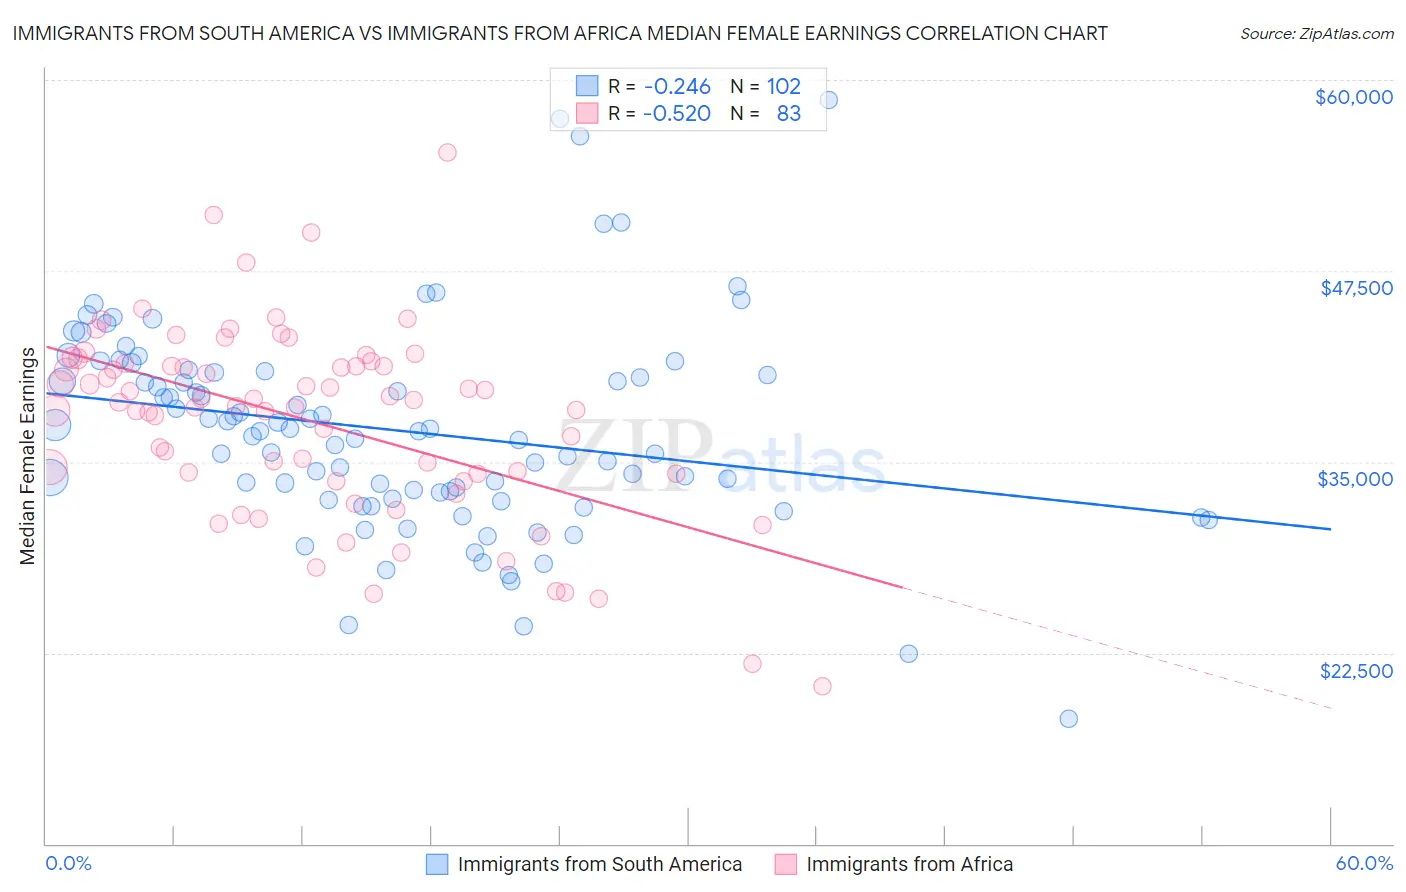
Immigrants from South America vs Immigrants from Africa Median Female Earnings Correlation Chart
The statistical analysis conducted on geographies consisting of 486,047,092 people shows a weak negative correlation between the proportion of Immigrants from South America and median female earnings in the United States with a correlation coefficient (R) of -0.246 and weighted average of $39,643. Similarly, the statistical analysis conducted on geographies consisting of 469,175,130 people shows a substantial negative correlation between the proportion of Immigrants from Africa and median female earnings in the United States with a correlation coefficient (R) of -0.520 and weighted average of $40,257, a difference of 1.5%.
Median Female Earnings Correlation Summary
| Measurement | Immigrants from South America | Immigrants from Africa |
| Minimum | $18,150 | $20,281 |
| Maximum | $58,709 | $55,224 |
| Range | $40,559 | $34,943 |
| Mean | $37,049 | $37,710 |
| Median | $37,037 | $38,916 |
| Interquartile 25% (IQ1) | $32,572 | $34,205 |
| Interquartile 75% (IQ3) | $40,849 | $41,443 |
| Interquartile Range (IQR) | $8,277 | $7,238 |
| Standard Deviation (Sample) | $6,851 | $6,266 |
| Standard Deviation (Population) | $6,817 | $6,228 |
Demographics Similar to Immigrants from South America and Immigrants from Africa by Median Female Earnings
In terms of median female earnings, the demographic groups most similar to Immigrants from South America are South American ($39,698, a difference of 0.14%), Canadian ($39,724, a difference of 0.20%), British ($39,772, a difference of 0.32%), Immigrants from Portugal ($39,788, a difference of 0.37%), and Slovene ($39,817, a difference of 0.44%). Similarly, the demographic groups most similar to Immigrants from Africa are Peruvian ($40,234, a difference of 0.060%), Portuguese ($40,177, a difference of 0.20%), Immigrants from Senegal ($40,157, a difference of 0.25%), Immigrants from Vietnam ($40,153, a difference of 0.26%), and Inupiat ($40,080, a difference of 0.44%).
| Demographics | Rating | Rank | Median Female Earnings |
| Immigrants | Africa | 76.2 /100 | #155 | Good $40,257 |
| Peruvians | 75.3 /100 | #156 | Good $40,234 |
| Portuguese | 73.0 /100 | #157 | Good $40,177 |
| Immigrants | Senegal | 72.2 /100 | #158 | Good $40,157 |
| Immigrants | Vietnam | 72.0 /100 | #159 | Good $40,153 |
| Inupiat | 68.9 /100 | #160 | Good $40,080 |
| Alsatians | 68.0 /100 | #161 | Good $40,060 |
| South American Indians | 66.1 /100 | #162 | Good $40,019 |
| Lebanese | 65.5 /100 | #163 | Good $40,006 |
| Immigrants | Saudi Arabia | 62.9 /100 | #164 | Good $39,952 |
| Immigrants | Bangladesh | 60.8 /100 | #165 | Good $39,910 |
| Immigrants | Ghana | 60.0 /100 | #166 | Good $39,894 |
| Luxembourgers | 59.9 /100 | #167 | Average $39,891 |
| Immigrants | Peru | 58.9 /100 | #168 | Average $39,871 |
| Kenyans | 58.4 /100 | #169 | Average $39,860 |
| Slovenes | 56.2 /100 | #170 | Average $39,817 |
| Immigrants | Portugal | 54.7 /100 | #171 | Average $39,788 |
| British | 53.8 /100 | #172 | Average $39,772 |
| Canadians | 51.4 /100 | #173 | Average $39,724 |
| South Americans | 50.0 /100 | #174 | Average $39,698 |
| Immigrants | South America | 47.2 /100 | #175 | Average $39,643 |