Swiss vs South American Householder Income Ages 45 - 64 years
COMPARE
Swiss
South American
Householder Income Ages 45 - 64 years
Householder Income Ages 45 - 64 years Comparison
Swiss
South Americans
$103,071
HOUSEHOLDER INCOME AGES 45 - 64 YEARS
79.9/ 100
METRIC RATING
151st/ 347
METRIC RANK
$100,837
HOUSEHOLDER INCOME AGES 45 - 64 YEARS
56.4/ 100
METRIC RATING
171st/ 347
METRIC RANK
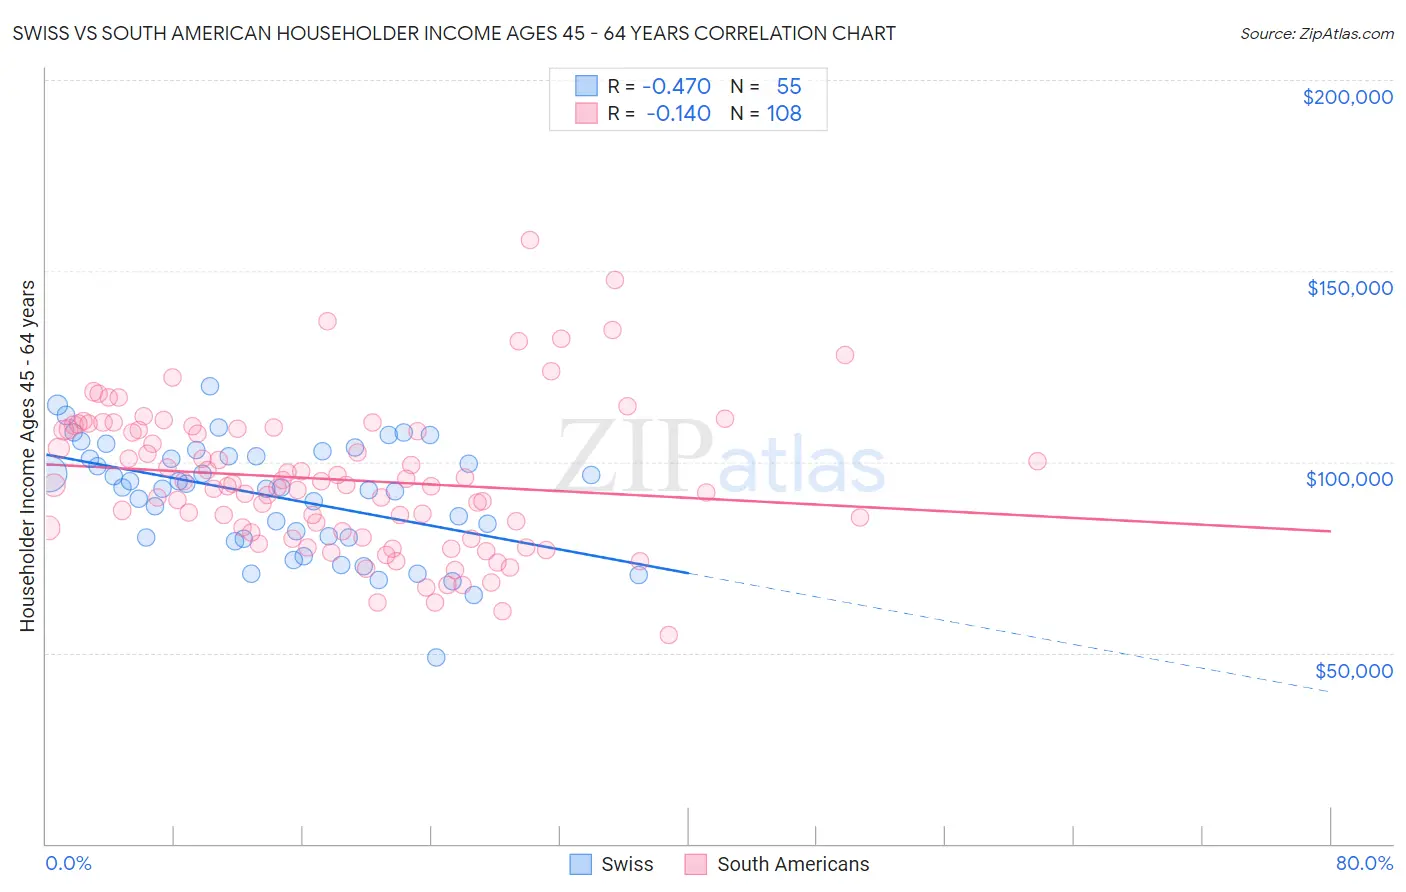
Swiss vs South American Householder Income Ages 45 - 64 years Correlation Chart
The statistical analysis conducted on geographies consisting of 463,835,295 people shows a moderate negative correlation between the proportion of Swiss and household income with householder between the ages 45 and 64 in the United States with a correlation coefficient (R) of -0.470 and weighted average of $103,071. Similarly, the statistical analysis conducted on geographies consisting of 492,624,098 people shows a poor negative correlation between the proportion of South Americans and household income with householder between the ages 45 and 64 in the United States with a correlation coefficient (R) of -0.140 and weighted average of $100,837, a difference of 2.2%.
Householder Income Ages 45 - 64 years Correlation Summary
| Measurement | Swiss | South American |
| Minimum | $48,631 | $54,659 |
| Maximum | $119,830 | $158,009 |
| Range | $71,199 | $103,350 |
| Mean | $90,919 | $95,419 |
| Median | $93,146 | $93,921 |
| Interquartile 25% (IQ1) | $80,104 | $81,601 |
| Interquartile 75% (IQ3) | $101,628 | $108,663 |
| Interquartile Range (IQR) | $21,524 | $27,062 |
| Standard Deviation (Sample) | $14,599 | $18,909 |
| Standard Deviation (Population) | $14,465 | $18,822 |
Demographics Similar to Swiss and South Americans by Householder Income Ages 45 - 64 years
In terms of householder income ages 45 - 64 years, the demographic groups most similar to Swiss are Irish ($103,067, a difference of 0.0%), Scandinavian ($102,969, a difference of 0.10%), Slovene ($102,885, a difference of 0.18%), Costa Rican ($102,779, a difference of 0.28%), and Carpatho Rusyn ($102,777, a difference of 0.29%). Similarly, the demographic groups most similar to South Americans are Slovak ($101,029, a difference of 0.19%), South American Indian ($101,171, a difference of 0.33%), Guamanian/Chamorro ($101,170, a difference of 0.33%), Czechoslovakian ($101,387, a difference of 0.54%), and Samoan ($101,580, a difference of 0.74%).
| Demographics | Rating | Rank | Householder Income Ages 45 - 64 years |
| Swiss | 79.9 /100 | #151 | Good $103,071 |
| Irish | 79.8 /100 | #152 | Good $103,067 |
| Scandinavians | 79.0 /100 | #153 | Good $102,969 |
| Slovenes | 78.3 /100 | #154 | Good $102,885 |
| Costa Ricans | 77.4 /100 | #155 | Good $102,779 |
| Carpatho Rusyns | 77.4 /100 | #156 | Good $102,777 |
| Immigrants | Ethiopia | 77.3 /100 | #157 | Good $102,763 |
| Slavs | 76.1 /100 | #158 | Good $102,629 |
| Sierra Leoneans | 74.2 /100 | #159 | Good $102,427 |
| Icelanders | 72.5 /100 | #160 | Good $102,261 |
| Immigrants | Nepal | 71.8 /100 | #161 | Good $102,190 |
| Scottish | 71.1 /100 | #162 | Good $102,123 |
| English | 70.1 /100 | #163 | Good $102,021 |
| Immigrants | Morocco | 70.0 /100 | #164 | Good $102,015 |
| Immigrants | Albania | 69.4 /100 | #165 | Good $101,957 |
| Samoans | 65.3 /100 | #166 | Good $101,580 |
| Czechoslovakians | 63.0 /100 | #167 | Good $101,387 |
| South American Indians | 60.5 /100 | #168 | Good $101,171 |
| Guamanians/Chamorros | 60.5 /100 | #169 | Good $101,170 |
| Slovaks | 58.8 /100 | #170 | Average $101,029 |
| South Americans | 56.4 /100 | #171 | Average $100,837 |